Top 5 Crypto Trading Patterns
Crypto trading patterns are common movements in the way the price of a cryptocurrency tends to trend. These patterns can be seen on a trading chart and should form the basis of any cryptocurrency trading strategy.
Crypto Trading Patterns
Crypto trading patterns are common movements in the way the price of a cryptocurrency tends to trend. These patterns can be seen on a trading chart and should form the basis of any cryptocurrency trading strategy.
This article will look at the 5 top patterns that you should know.
1) Head and Shoulders
Head and shoulders is a chart pattern that be distinguished by its 3 peaks; with one large peak in the middle and two smaller peaks on either side. The pattern signifies a reversal in trend and therefore can be used to help determine when a bullish trend is coming to an end.
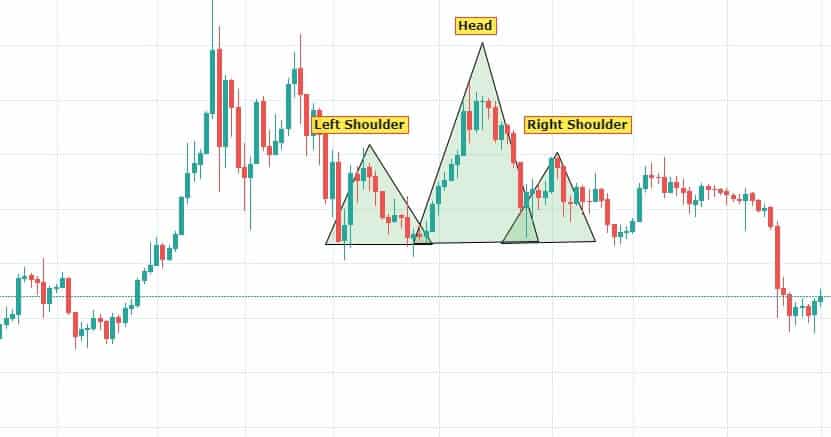
As can be seen from the BTC/USD chart above, a head and shoulder pattern is formed followed by a dip in price.
2) Cup and Handle
A cup and handle pattern can be spotted on a trading chart by looking for a bowl shape followed by a smaller one which resembles a handle.
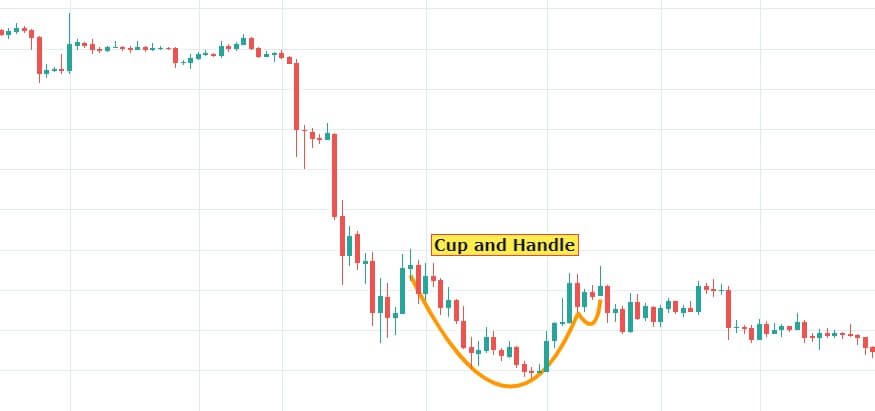
The cup and handle pattern is a bullish signal that is usually an indicator for a trader to purchase a cryptocurrency. This is because the pattern indicates that a trend is reversing from bearish to bullish, hence, the cup.
However, as can be seen from the BTC/USD chart above, this is a false signal, therefore, this pattern should always be used in combination with out trading patterns before coming to a trading decision.
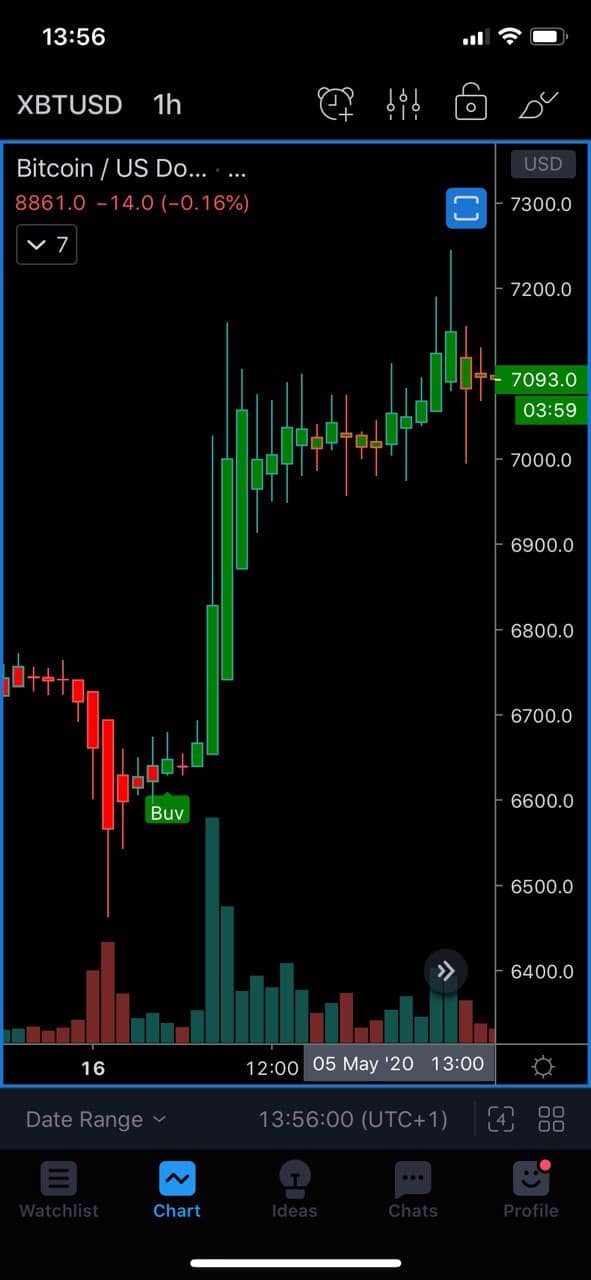
3) Flag
More crypto trading patterns to look for include: the flag. This is a bullish pattern that can be discerned on a chart by looking for rectangle shape pointing downwards with rightmost border missing; the flag is also accompanied by a flagpole.
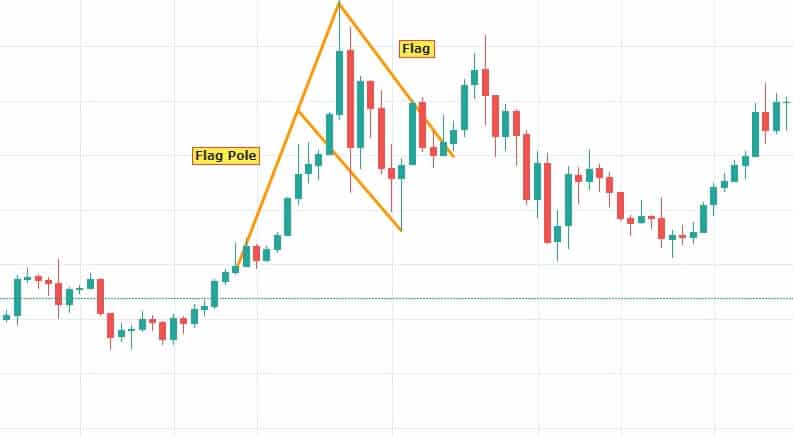
The purpose of the flag pattern is to identify the possible continuation of a previous trend that has been reversed. For example, from the BTC/USD chart above, there is a clear initial uptrend (flagpole) which is momentarily reversed resulting in a downtrend.
However, the flag pattern tells us that this downtrend is only momentary and that the uptrend will once again resume, which is what ends up happening in the chart above.
Even though a flag pattern may indicate a continuing uptrend, it is important to look at the volume to see if this uptrend can be sustained.
4) Higher Highs, Lower Lows
Higher Highs and Lower Lows is a particularly useful pattern for identifying if a cryptocurrency is an uptrend or a downtrend.
If a crypto is consistently hitting higher and higher price targets, then it is considered to be in an uptrend. Conversely, if a crypto is consistently hitting lower and lower price targets, then it may be in a downtrend.
Below is an example crypto chart pattern of higher highers:
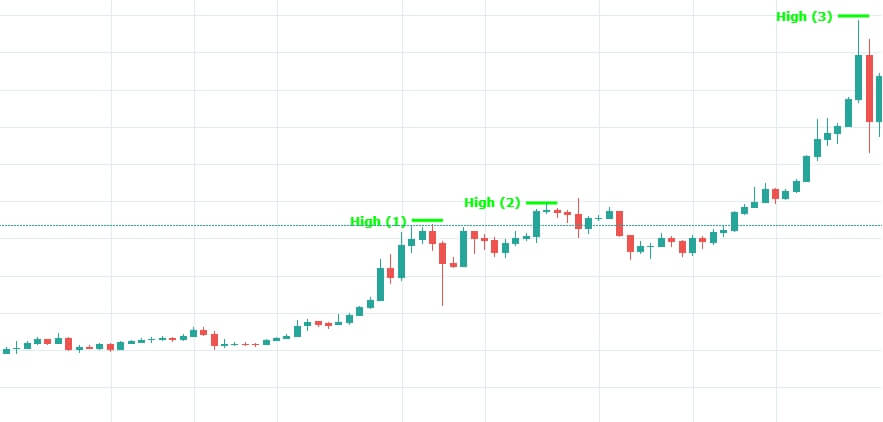
The higher highs indicate rising bullish sentiment as more investors are willing to pay a higher price for a particular crypto. This is nearly always a good sign.
Any small dip in price in the middle of a crypto hitting higher price targets will most likely be because of traders taking profit.
Below is an example chart pattern of lower lows:
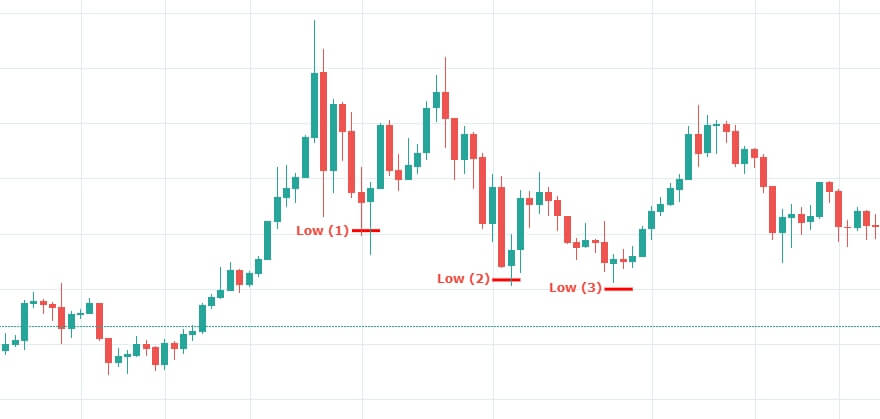
A cryptocurrency’s price consistently hitting lower price targets is a strong indication that it is in a downtrend. At a basic level, it means that traders are buying and selling the crypto at lower and lower price targets.
This overwhelmingly negative sentiment may spook investors and result in further price declines. In moments like these, it’s important to look for triggers that may signal a reversal, whether it’s a piece of good news or flag pattern.
Crypto trading patterns have different uses, but the key purpose of the higher highs and lower lows pattern really is to identify the general trend a cryptocurrency is moving in.
Once a trader is able to do this, he will often utilize other charts and tools to allow him/her to make a more informed trading decision.
5) Wedge
A wedge pattern can be spotted on a chart by looking for two parallel lines converging over a period of time.
A wedge is typically used to look for a price reversal. For example, if the price of a cryptocurrency is trending upwards in a wedge, the price may then reverse into a downtrend.
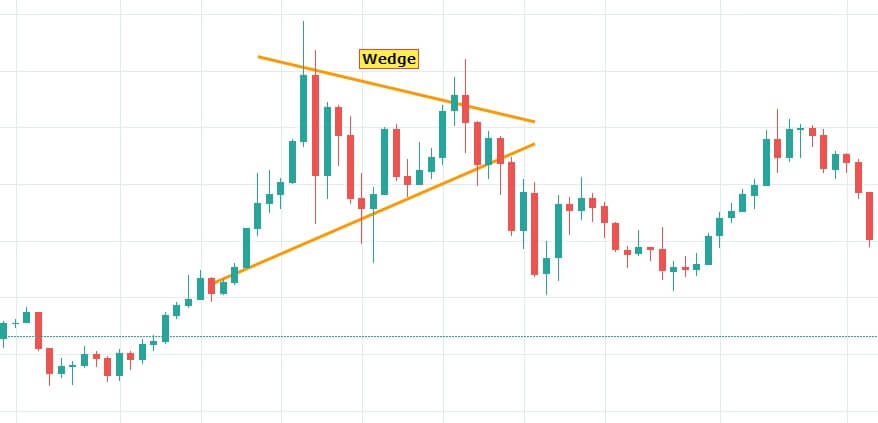
As can been seen from the BTC/USD chart above, awedge is being formed, with the price then reversing into a downward trend as the trading range starts to tighten.
Did you know we made our own indicator!
AltSignals has been working very hard in order to create a financial indicator to trade virtual currencies and other assets. The team of experts and analysts behind this company created a great indicator that would allow you to receive a clear indication where to enter or exit a trade.
As you will see in the following images, the indicator provides clear data about good market opportunities in a wide range of digital assets. The interesting thing about this trading indicator is the fact that it works with the Heikin Ashi bars on the chart.
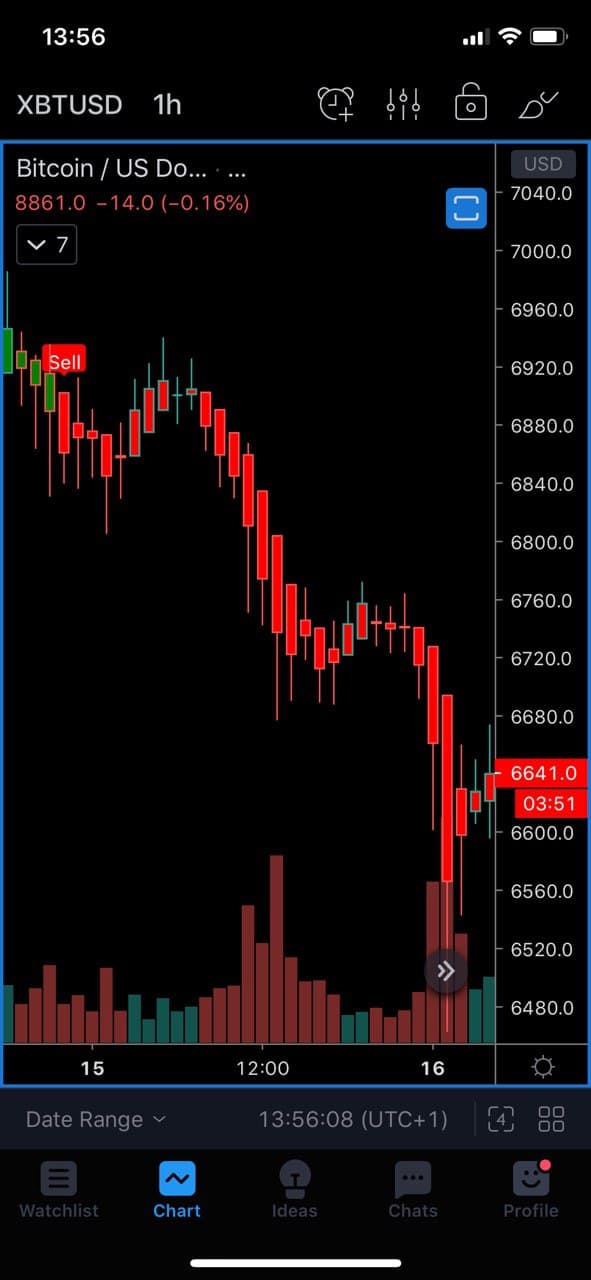
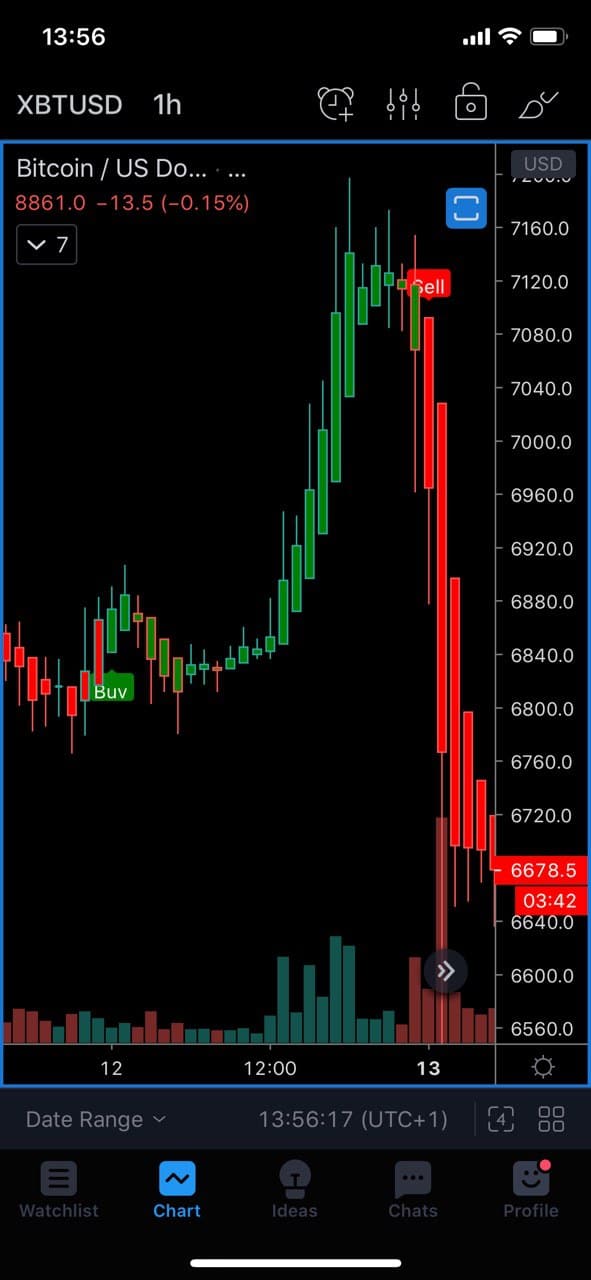
The indicator works properly with 1 hour charts and it provides clear information for both beginner users that want to learn how to trade or make some profits in the market. Meanwhile, expert users will have the possibility to get a confirmation on whether their trades were in the correct or not. Furthermore, they will gain an advantage over other traders because they will have a very accurate and useful indicator that would allow them to better analyse the markets.
AltSignals is also providing great crypto signals to traders in the market. Users can easily follow the AltSignals trading Telegram group to receive daily information about the markets. In addition to it, they provide daily trading signals in a wide range of exchanges, including Binance, BitMex and FX platforms. Furthermore, AltSignals analysts provide data about why the market is going in a specific direction and what individuals can expect from the markets.
Conclusion
To conclude, the ability to spot basic crypto trading patterns should be in the toolkit of any investor or trader. Patterns allow traders to be able to determine whether a market is in an uptrend or a downtrend, as well as when a potential price reversal may occur.
One important thing to remember is that chart patterns also have their inverses.
All of the patterns looked at in this article can be found when the market is rising, but they can also be found in a down market too, hence the term inverse.
Image sourced by https://immediate.net/


We are a large scale cryptocurrency community
providing you with access to some of the most exclusive, game changing cryptocurrency signals, newsletters, magazines, trading indicators, tools and more.
Your investments are your responsibility
We do not accept any liability for any loss or damage which is incurred from you acting or not acting as a result of reading any of our publications. You acknowledge that you use the information we provide at your own risk.
Altsignals does not offer investment advice and nothing in the calls we make should be construed as investment advice. Altsignals provides information and education based on our own trades. You are paying to follow our trades that we document for educational purposes.