

All News
June 16, 2025
Understanding Bitcoin Candlestick Charts: A Comprehensive Guide for Crypto Traders


Latest posts by James Carter
-


Cerebras Systems faces investor uncertainty as its stock drops post-IPO despite delivering strong Q1 revenue growth and forming major AI industry partnerships. Analysts remain cautious amid concerns over margin guidance and market volatility, with the company’s future hinging on scaling success, profitability, and the impact of deals with OpenAI and AWS.
Read more -
uk launches comprehensive cryptoasset regulatory framework putting the financial conduct authority in charge of overseeing exchanges, custodians and service providers this new regime aligns digital assets with traditional financial laws enhances consumer protection and operational standards and sets challenges for firms seeking compliance the framework aims to boost market confidence encourage institutional participation and position the uk as a leader in regulated digital finance
Read more -
Comprehensive recap of the latest market session covering Comcast’s strategic company split, Alphabet joining the Dow Jones, tech stock rebound, anticipation for Nike earnings, and rising oil prices amid Middle East tensions. Get insights on market resilience, evolving corporate strategies, consumer confidence, and global economic challenges impacting investors in 2024
Read more -
Binance launches its Word of the Day campaign focused on AI-powered stock trading, offering BNB token rewards for user participation. Discover how this initiative bridges artificial intelligence and finance, promotes crypto education, and boosts engagement while highlighting the growing role of AI in market innovation. Learn about campaign eligibility, regulatory considerations, and how BNB rewards enhance the user experience on Binance
Read more -
Zcash ZEC stands out as a leading privacy-focused cryptocurrency, offering shielded transactions through zero-knowledge proof technology. This in-depth outlook examines Zcash’s potential for growth or decline by 2031, exploring bullish and bearish scenarios shaped by privacy trends, regulatory pressures, institutional interest, and exchange accessibility. Discover price forecasts, adoption catalysts, and key risks that will define Zcash’s future in the evolving crypto landscape.
Read more -
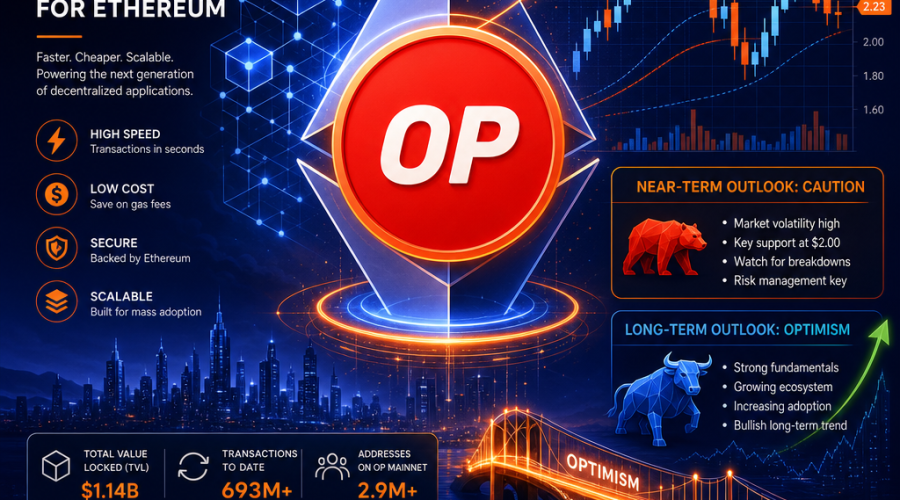
seo_meta_description: Discover the latest technical analysis and price predictions for Optimism OP, Ethereum’s leading Layer 2 scaling solution. Explore current market trends, expert forecasts for 2026 to 2032, investment outlook, and recent ecosystem developments to help guide your OP crypto investment decisions.
Read more -
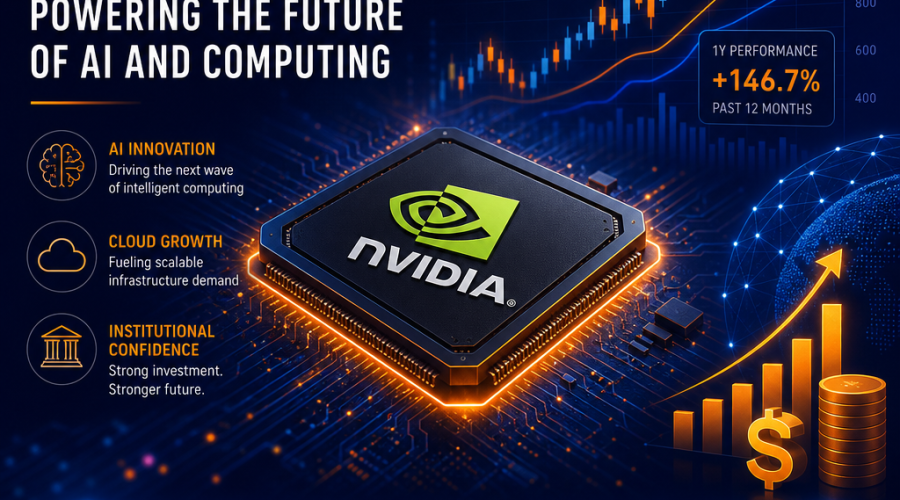
Nvidia’s stock performance is under the spotlight amid AI and chip sector growth, with recent volatility, strong institutional investment, and a robust earnings report driving Wall Street optimism. Explore analyst forecasts, insider activity, valuation insights, and competitive risks as Nvidia navigates shifting tech market dynamics, evolving capital returns, and its pivotal role in AI and data centers.
Read more -
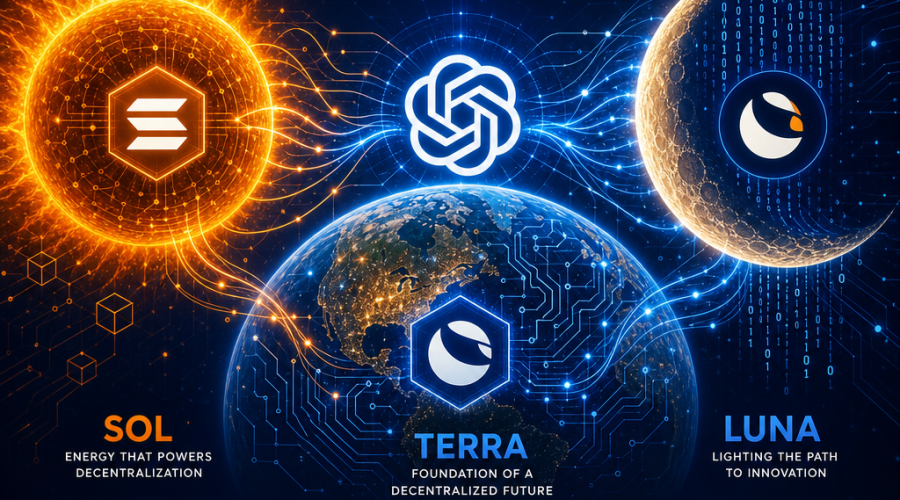
OpenAI has unveiled its new GPT-5.6 family of large language models named Sol, Terra, and Luna, generating buzz across both artificial intelligence and cryptocurrency sectors. This strategic naming references major blockchain projects and events, highlighting the convergence of AI and crypto. The new models offer enhanced performance, cost efficiency, and adaptability for enterprise applications, with each version targeting different user needs. As the AI and crypto industries increasingly intersect, OpenAI’s latest release sparks conversation about technological evolution, industry collaboration, and the lessons learned from past digital asset successes and failures.
Read more -
Bitcoin faces intense volatility as $10 billion in options contracts expire, triggering a major reset and shifting investor focus toward high-upside presale tokens like Pepeto. Explore Bitcoin price predictions, ETF outflows, and the growing trend of smart money moving into innovative crypto projects offering exponential returns. Discover why the next cycle may be led by breakout tokens rather than traditional recovery trades
Read more


Latest posts from the category All News
-
Cerebras Systems faces investor uncertainty as its stock drops post-IPO despite delivering strong Q1 revenue growth and forming major AI industry partnerships. Analysts remain cautious amid concerns over margin guidance and market volatility, with the company’s future hinging on scaling success, profitability, and the impact of deals with OpenAI and AWS.
Read more -
uk launches comprehensive cryptoasset regulatory framework putting the financial conduct authority in charge of overseeing exchanges, custodians and service providers this new regime aligns digital assets with traditional financial laws enhances consumer protection and operational standards and sets challenges for firms seeking compliance the framework aims to boost market confidence encourage institutional participation and position the uk as a leader in regulated digital finance
Read more -
Comprehensive recap of the latest market session covering Comcast’s strategic company split, Alphabet joining the Dow Jones, tech stock rebound, anticipation for Nike earnings, and rising oil prices amid Middle East tensions. Get insights on market resilience, evolving corporate strategies, consumer confidence, and global economic challenges impacting investors in 2024
Read more -
Binance launches its Word of the Day campaign focused on AI-powered stock trading, offering BNB token rewards for user participation. Discover how this initiative bridges artificial intelligence and finance, promotes crypto education, and boosts engagement while highlighting the growing role of AI in market innovation. Learn about campaign eligibility, regulatory considerations, and how BNB rewards enhance the user experience on Binance
Read more -
Zcash ZEC stands out as a leading privacy-focused cryptocurrency, offering shielded transactions through zero-knowledge proof technology. This in-depth outlook examines Zcash’s potential for growth or decline by 2031, exploring bullish and bearish scenarios shaped by privacy trends, regulatory pressures, institutional interest, and exchange accessibility. Discover price forecasts, adoption catalysts, and key risks that will define Zcash’s future in the evolving crypto landscape.
Read more -
seo_meta_description: Discover the latest technical analysis and price predictions for Optimism OP, Ethereum’s leading Layer 2 scaling solution. Explore current market trends, expert forecasts for 2026 to 2032, investment outlook, and recent ecosystem developments to help guide your OP crypto investment decisions.
Read more -
Nvidia’s stock performance is under the spotlight amid AI and chip sector growth, with recent volatility, strong institutional investment, and a robust earnings report driving Wall Street optimism. Explore analyst forecasts, insider activity, valuation insights, and competitive risks as Nvidia navigates shifting tech market dynamics, evolving capital returns, and its pivotal role in AI and data centers.
Read more -
OpenAI has unveiled its new GPT-5.6 family of large language models named Sol, Terra, and Luna, generating buzz across both artificial intelligence and cryptocurrency sectors. This strategic naming references major blockchain projects and events, highlighting the convergence of AI and crypto. The new models offer enhanced performance, cost efficiency, and adaptability for enterprise applications, with each version targeting different user needs. As the AI and crypto industries increasingly intersect, OpenAI’s latest release sparks conversation about technological evolution, industry collaboration, and the lessons learned from past digital asset successes and failures.
Read more -
Bitcoin faces intense volatility as $10 billion in options contracts expire, triggering a major reset and shifting investor focus toward high-upside presale tokens like Pepeto. Explore Bitcoin price predictions, ETF outflows, and the growing trend of smart money moving into innovative crypto projects offering exponential returns. Discover why the next cycle may be led by breakout tokens rather than traditional recovery trades
Read more -
Cardano ADA is experiencing a surge in on-chain activity and user engagement despite recent price stagnation, governance disputes, and a major security incident. This detailed analysis explores the factors behind Cardano’s rising network participation, ongoing community debates, security challenges, and the potential impact on ADA’s future price trajectory amid changing crypto market conditions.
Read more -
Nexchain AI is revolutionizing blockchain technology by integrating advanced artificial intelligence with a robust Layer-1 infrastructure to deliver superior security, intelligent risk alerts, high scalability, and user-friendly tools. As the project enters its final coin presale phase, early supporters can join a rapidly advancing ecosystem ahead of the anticipated Q4 2026 mainnet launch. Learn about Nexchain AI’s strategic roadmap, technical innovations, industry use cases, and the unique value it brings to the future of decentralized networks.
Read more -
altcoin market faces a pivotal moment after four years of consolidation with renewed focus on projects like SUI SEI ETH NEAR and HBAR driving growth through innovation scalability and real-world adoption as investors anticipate a potential breakout and key developments ahead of 2026
Read more


Subscribe to new posts
Receive the most up to date insights & strategies
Your investments are your responsibility
We do not accept any liability for any loss or damage which is incurred from you acting or not acting as a result of reading any of our publications. You acknowledge that you use the information we provide at your own risk.
Altsignals does not offer investment advice and nothing in the calls we make should be construed as investment advice. Altsignals provides information and education based on our own trades. You are paying to follow our trades that we document for educational purposes.
