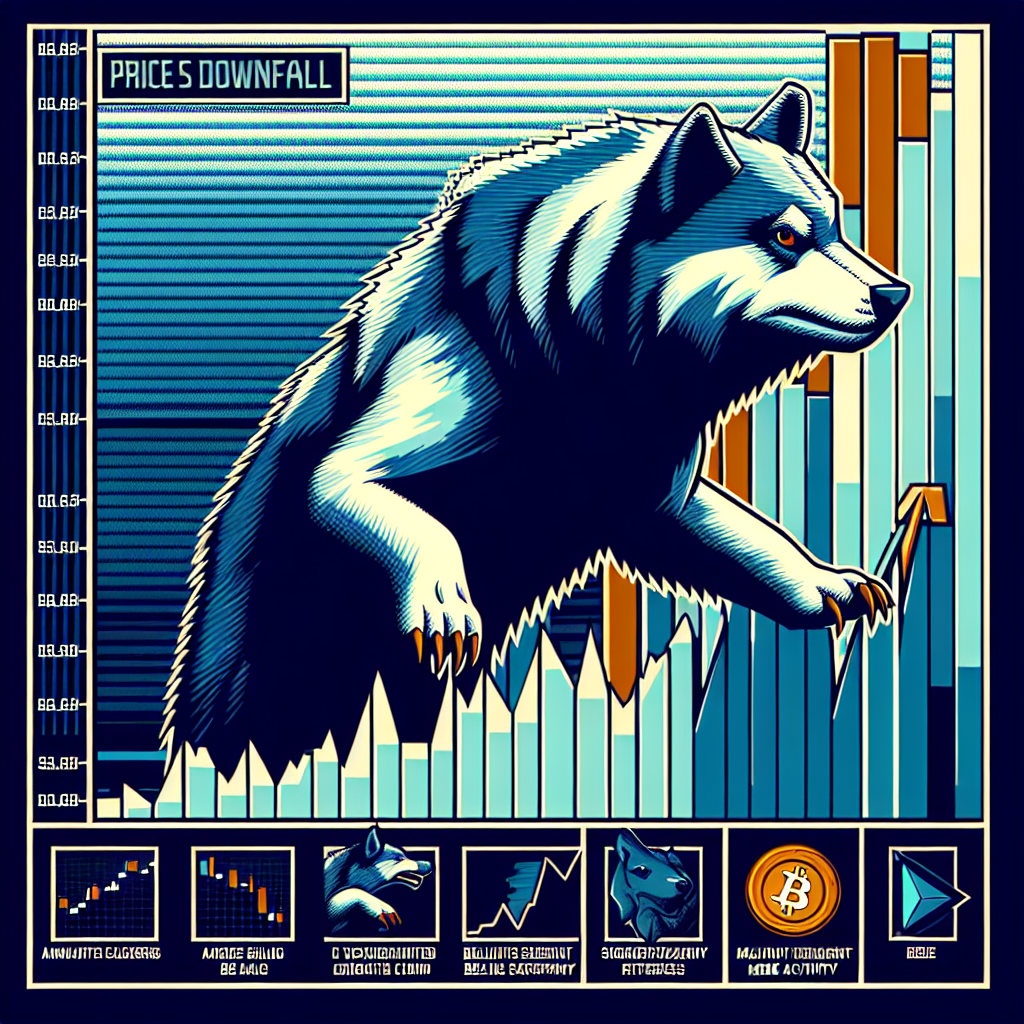
Shiba Inu’s Downward Price Trend – A Detailed Analysis
In the landscape of digital currencies, Shiba Inu has made quite a reputation as a strong contender. However, things have not been going as positively as expected lately. In a landscape marked by constant flux, Shiba Inu’s price has remained consistently on a downward trend this year. On top of this, a rarely seen chart plot and the behaviour of the cryptocurrency’s largest holders point at further depreciation.
Understanding the Causes
Several significant events have led to this alarming trend. For instance, Shiba Inu price has formed a descending triangle pattern on its daily chart recently. This pattern symbolizes a bearish outlook, suggesting that the token could continue falling. Moreover, it has been observed the whales, i.e., the biggest SHIB coin holders, have started liquidating their SHIB assets this week.
Alongside this, there has been an observable rise in the volume of Shiba Inu tokens in exchanges. This increase is a reliable indication that SHIB owners have started selling their tokens, leading to a disproportionate supply that inevitably pressures prices downwards. The extent of effect could be gauged from the fact that Shiba Inu, once the biggest Ethereum meme coin, suffered a severe price crash of 70% from its record high in December last year, plunging from $0.00001052. This dramatic plunge eliminated billions of dollars in value and caused the market cap to dwindle to $6.9 billion from a November high of $18.8 billion.
A Closer Examination
The dynamics of these digital currencies are susceptible to various factors. Fundamentals of the token such as the supply of SHIB coins on exchange platforms have started to increase rapidly this week. Currently, there are about 276 trillion tokens, which is up from 275 trillion the previous week. This indicates a significant number of investors pulling out.
It’s not just the average investors; key stakeholders or ‘whales’ have started to offload their tokens as well. They currently hold about 91.96 billion tokens, which is down from 213 billion this week. Adding to this, the significant, smart-money investors have noticeably reduced their holdings in SHIB over the past few weeks.
Shibarium’s Waning Activity
Further exacerbating the situation is the declining operation in Shibarium, a sister network to Shiba Inu. The total value locked in it has plummeted to only $865,000, a massive 50% drop from a month ago. This dramatic fall has escalated after the unfortunate incident of a recent ShibaSwap network breach.


Looking from the perspective of Shiba Inu’s burn rate, things do not seem too promising either. The burn rate has been on a steady decline in the past few months. For instance, only 571,347 SHIB coins worth approximately $5 were burned on Wednesday. One of the primary move behind this declining trend is the fact that the Shibarium network is not generating enough return.
Technical Analysis of Shiba Inu’s Price
When viewed from a technical perspective, the daily timeframe chart shows SHIB price has been on a steady decline this year. It has now formed a descending triangle pattern with its lower side situated at its lowest point in April and June this year. Furthermore, the upper side connects to the highest swing since February.
This pattern was confirmed last week during the significant cryptocurrency market crash. A notable break-and-retest pattern has been formed as SHIB price moves back to the lower side of the triangle. Looking at these analysis, it seems likely that the token will continue its downward trend and possibly plummet to a new low of $0.0000060.
This target estimation is based on measuring the widest point of the triangle and applying the same distance from the triangle’s lower side. Now as the coin holders, investors, and market observers monitor these movements, only time will tell how Shiba Inu will fare in this fluctuating world of cryptocurrencies.