

All News
August 27, 2025
Bitcoin’s Decline Sparks Concern: Key Support and Resistance Levels to Watch


Latest posts by James Carter
-


Global cryptocurrency markets on July 10, 2026, saw a mix of gains and losses as major coins like Bitcoin and Solana rose, while others such as Ethereum and MemeCore faced declines. This in-depth analysis covers notable price changes, explores top gainers and losers like Arbitrum, examines altcoin trends, reviews new token listings, and offers insights and strategies for investors navigating the volatile digital asset landscape
Read more -
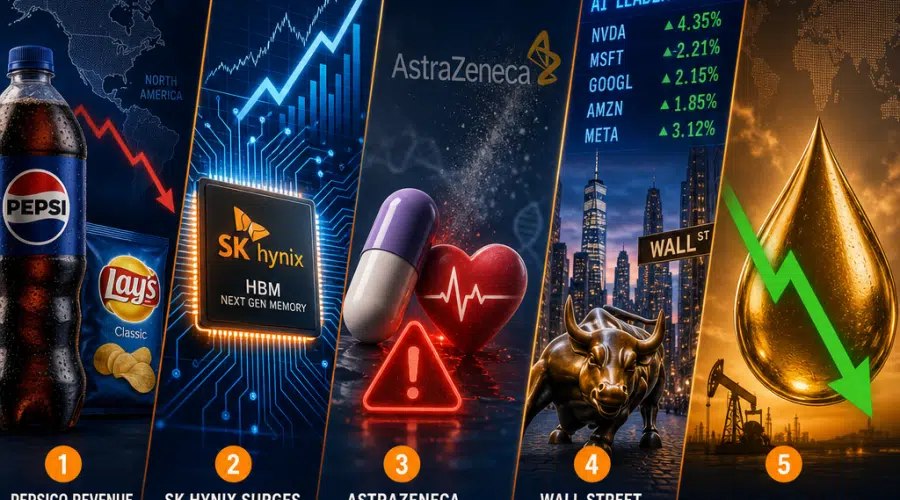
PepsiCo beats global revenue expectations but faces investor concerns as North American snack sales slow and management issues cautious guidance. The latest market roundup also covers SK Hynix’s AI-driven IPO success, AstraZeneca’s clinical trial setback, a resilient U.S. equity rally led by tech and AI stocks, and easing oil prices providing relief to consumers and businesses. Explore key trends shaping the consumer goods, technology, pharmaceutical, equity, and energy sectors this earnings season.
Read more -
authorities in the moscow region have shut down an illegal bitcoin mining operation run by a 68-year-old retiree near yegoryevsk, spotlighting the growing risks and challenges of underground cryptocurrency mining in russia. the case reveals the severe impact on local electricity infrastructure, drives discussion around stricter regulations, and signals a shift toward greater enforcement and higher compliance costs for miners across the country
Read more -
Morpho has raised 175 million dollars in a funding round co-led by Paradigm, a16z crypto, and Ribbit Capital to expand its blockchain lending infrastructure globally. The platform is accelerating DeFi adoption by integrating with major platforms like Coinbase, Robinhood, and Deel, introducing privacy-first institutional products, and partnering with leading VCs and fintechs. Morpho aims to revolutionize global credit markets, offering secure, compliant, and accessible onchain lending solutions for both crypto-native and traditional financial sectors.
Read more -
Ukraine becomes the first nation to place $8.3 million in seized Tether (USDT) under direct state management, marking a milestone in digital asset recovery and crypto regulation. Learn how this move redefines government procedures for confiscated cryptocurrencies, sets global precedents, and advances Ukraine’s role in digital finance and security.
Read more -
CoreWeave shares fell over 19 percent this week as Meta and SoftBank announce plans to enter the AI cloud market, sparking fears of increased competition and shifting industry dynamics. Learn how CoreWeave, its investors, and analysts are responding to market volatility, competitive threats, and the fast-growing demand for AI infrastructure in the evolving neocloud sector
Read more -
Ark Invest increased its stakes in Coinbase and Circle during the June 2024 crypto market downturn, demonstrating confidence in blockchain infrastructure despite sector volatility. Learn how these strategic buys affirm Ark’s bullish outlook on digital asset adoption, the evolving roles of Coinbase and Circle in fintech, and key risks for investors considering crypto-linked equities
Read more -
Meta launches an ambitious AI cloud business as the Fed signals easing inflation, while US markets start H2 2026 strong. Read insights on sector performance, Nike’s China challenge, oil price moves, and the economic outlook shaping global investment strategies for the second half of the year.
Read more


Latest posts from the category All News
-
Global cryptocurrency markets on July 10, 2026, saw a mix of gains and losses as major coins like Bitcoin and Solana rose, while others such as Ethereum and MemeCore faced declines. This in-depth analysis covers notable price changes, explores top gainers and losers like Arbitrum, examines altcoin trends, reviews new token listings, and offers insights and strategies for investors navigating the volatile digital asset landscape
Read more -
PepsiCo beats global revenue expectations but faces investor concerns as North American snack sales slow and management issues cautious guidance. The latest market roundup also covers SK Hynix’s AI-driven IPO success, AstraZeneca’s clinical trial setback, a resilient U.S. equity rally led by tech and AI stocks, and easing oil prices providing relief to consumers and businesses. Explore key trends shaping the consumer goods, technology, pharmaceutical, equity, and energy sectors this earnings season.
Read more -
authorities in the moscow region have shut down an illegal bitcoin mining operation run by a 68-year-old retiree near yegoryevsk, spotlighting the growing risks and challenges of underground cryptocurrency mining in russia. the case reveals the severe impact on local electricity infrastructure, drives discussion around stricter regulations, and signals a shift toward greater enforcement and higher compliance costs for miners across the country
Read more -
Morpho has raised 175 million dollars in a funding round co-led by Paradigm, a16z crypto, and Ribbit Capital to expand its blockchain lending infrastructure globally. The platform is accelerating DeFi adoption by integrating with major platforms like Coinbase, Robinhood, and Deel, introducing privacy-first institutional products, and partnering with leading VCs and fintechs. Morpho aims to revolutionize global credit markets, offering secure, compliant, and accessible onchain lending solutions for both crypto-native and traditional financial sectors.
Read more -
Ukraine becomes the first nation to place $8.3 million in seized Tether (USDT) under direct state management, marking a milestone in digital asset recovery and crypto regulation. Learn how this move redefines government procedures for confiscated cryptocurrencies, sets global precedents, and advances Ukraine’s role in digital finance and security.
Read more -
CoreWeave shares fell over 19 percent this week as Meta and SoftBank announce plans to enter the AI cloud market, sparking fears of increased competition and shifting industry dynamics. Learn how CoreWeave, its investors, and analysts are responding to market volatility, competitive threats, and the fast-growing demand for AI infrastructure in the evolving neocloud sector
Read more -
Ark Invest increased its stakes in Coinbase and Circle during the June 2024 crypto market downturn, demonstrating confidence in blockchain infrastructure despite sector volatility. Learn how these strategic buys affirm Ark’s bullish outlook on digital asset adoption, the evolving roles of Coinbase and Circle in fintech, and key risks for investors considering crypto-linked equities
Read more -
Meta launches an ambitious AI cloud business as the Fed signals easing inflation, while US markets start H2 2026 strong. Read insights on sector performance, Nike’s China challenge, oil price moves, and the economic outlook shaping global investment strategies for the second half of the year.
Read more -
Over 140 top companies including Visa, Stripe, Coinbase, and BlackRock have joined forces to launch Open USD, an open and interoperable USD stablecoin project designed to connect traditional finance and the crypto economy. The initiative aims to create a widely accessible, trustworthy digital dollar infrastructure, driving mass adoption and revolutionizing global payments, settlements, and cross-border transactions.
Read more -
Cerebras Systems faces investor uncertainty as its stock drops post-IPO despite delivering strong Q1 revenue growth and forming major AI industry partnerships. Analysts remain cautious amid concerns over margin guidance and market volatility, with the company’s future hinging on scaling success, profitability, and the impact of deals with OpenAI and AWS.
Read more -
uk launches comprehensive cryptoasset regulatory framework putting the financial conduct authority in charge of overseeing exchanges, custodians and service providers this new regime aligns digital assets with traditional financial laws enhances consumer protection and operational standards and sets challenges for firms seeking compliance the framework aims to boost market confidence encourage institutional participation and position the uk as a leader in regulated digital finance
Read more -
Comprehensive recap of the latest market session covering Comcast’s strategic company split, Alphabet joining the Dow Jones, tech stock rebound, anticipation for Nike earnings, and rising oil prices amid Middle East tensions. Get insights on market resilience, evolving corporate strategies, consumer confidence, and global economic challenges impacting investors in 2024
Read more


Subscribe to new posts
Receive the most up to date insights & strategies
Your investments are your responsibility
We do not accept any liability for any loss or damage which is incurred from you acting or not acting as a result of reading any of our publications. You acknowledge that you use the information we provide at your own risk.
Altsignals does not offer investment advice and nothing in the calls we make should be construed as investment advice. Altsignals provides information and education based on our own trades. You are paying to follow our trades that we document for educational purposes.
