The Potential Downfall in the Price of Polygon
Technical predictions suggest the potential of a significant price decline for cryptocurrency Polygon. This speculation is rather surprising, given the increasing growth recorded within the platform’s stables and decentralized finance subsectors. Despite this development, the Polygon token, notorious as POL, traded at $0.2355 last Thursday, which is marginally below its weekly peak of $0.2765.
Stablecoin’s Rebound in Polygon’s Ecosystem
According to data collected from DeFi Llama, the level of stablecoins within the Polygon ecosystem has demonstrated a consistent growth throughout the month. The computed stablecoin supply has reached an impressive $1.98 billion, a considerable increase from the initial year-to-date lowest record of $1.67 billion.
Remarkably, Messari’s report indicates that the stablecoin quantity found on the network notably increased by 23% within the first quarter. Concurrently, an increase of 30% in the number of active stablecoin wallets was determined. In referencing Polygon’s market share, DAI emerged as the market leader with 47%, with USD Coin and Tether following suit at 31% and 13%, respectively.
Slow Recovery of the Total Value Locked on the Polygon Network
Moreover, data provided by Polygon showed a gradual increase in the total value locked (TVL) within the network. This figure is currently estimated at $1.03 billion, an increase from the year-to-date low of $736 million. This growth proved even more remarkable when examined with POL’s terms. The figure increased to 4.35 billion POL from the initially recorded 1.86 billion POL in January.
An Increase in Weekly Transactions on Polygon
Data from another leading blockchain analytics platform, Nansen, revealed a 9% increase in the number of weekly transactions executed on Polygon. The data showcased these transactions reaching 19.27 million, a higher rate than ARB’s 12 million. Additionally, it was noted that decentralized exchange transactions on Polygon rose by nearly a whopping 48.46% in the last week, reaching just under $1 billion.
Polygon’s Loss in Market Share
A pressing challenge facing Polygon is the market share it continues to lose to newer layer-2 networks, such as Unichain, Base, and Arbitrum. These platforms have made considerable strides since their inception. For instance, Unichain, a network launched in February, successfully managed to handle transactions surpassing $3.8 billion.


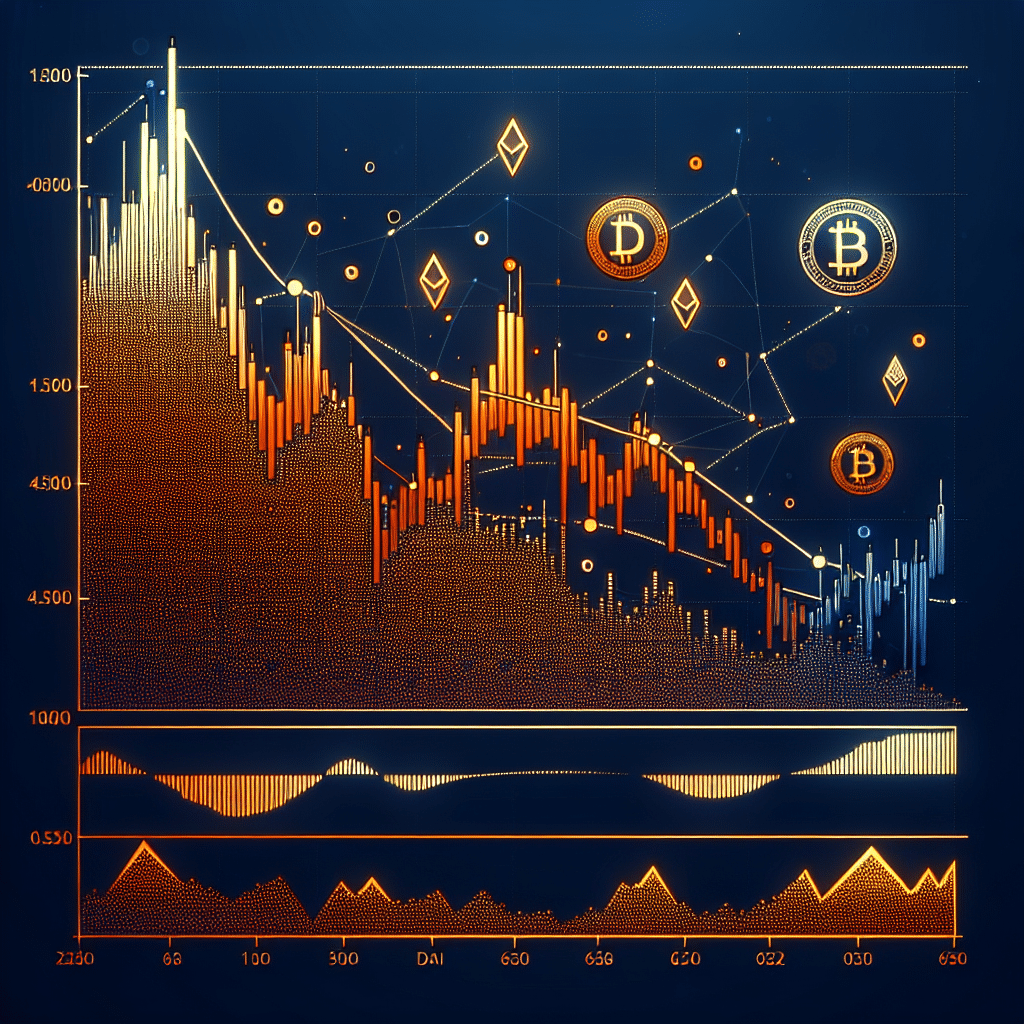
Polygon Price Technical Analysis
The daily chart illustrated that POL reached its low point ($0.1500) in April and rebounded as a consequence of the broader crypto market rally. The token neared a retest of its key resistance at $0.2863, mirroring last November’s low.
However, a noticeable effect is the slow emergence of a rising wedge pattern, characterized by two upwards-moving and concurring trendlines. This pattern typically indicates a potential bearish downtrend when the asset’s price approaches the point of convergence.
Predictions suggest that should a downturn occur, Polygon could potentially drop its next support level to April’s low, $0.1504. This makes up a difference of about 40% from its current price. However, a decisive surge above the $0.30 resistance mark could very well invalidate the bearish projection.
To conclude, Polygon’s potential and the calculations based on technical analysis indicate the probability of a significant decrease in the price of POL despite the continuous growth recorded within its decentralized finance and stablecoin activities. The Polygon token, known as POL, was valued at $0.2355, slightly below the peak value of this week at $0.2765. Nonetheless, the coin’s slow development of an ascending wedge design warns of an impending bearish drop when the price approaches the convergence point. However, surpassing the $0.30 level of resistance could ultimately dispel the bearish outlook.