

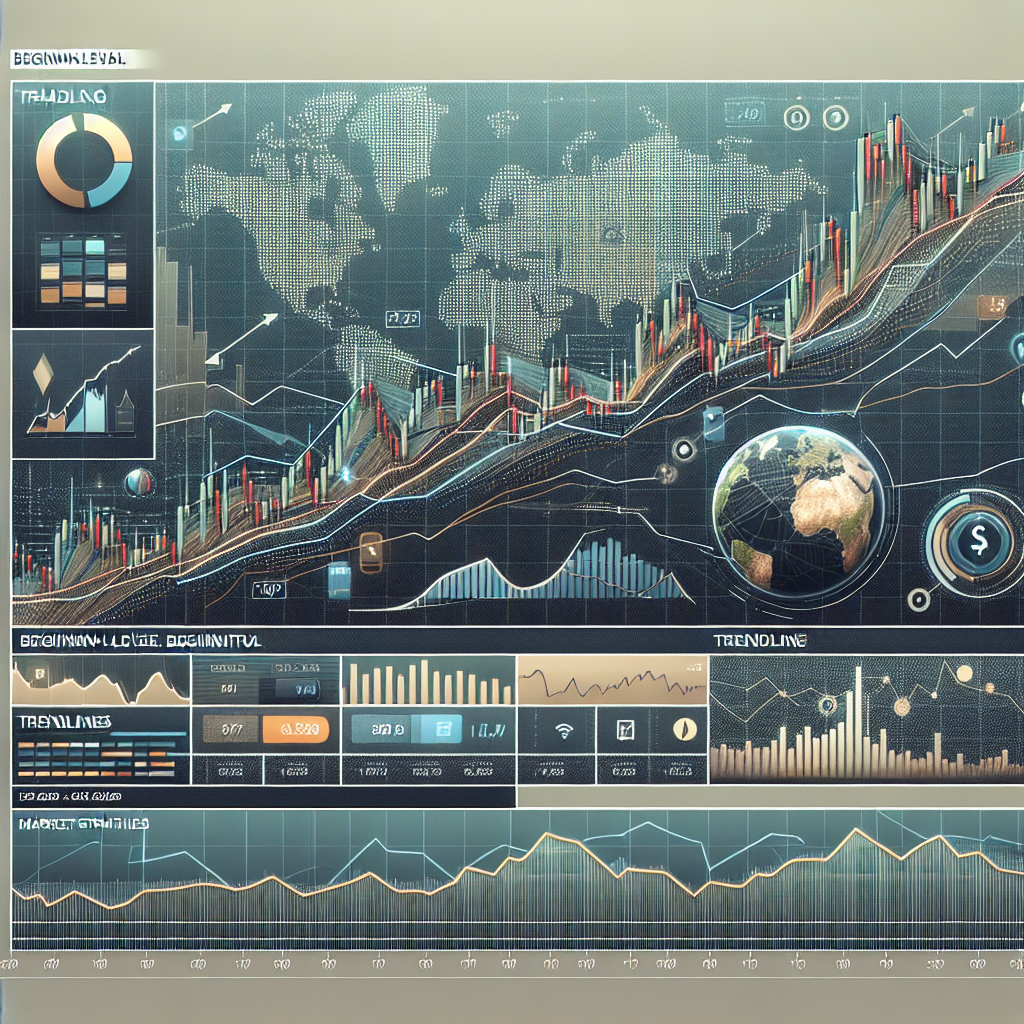
Trendlines are one of the first tools traders learn for a reason: they help you see structure quickly. A simple line connecting higher lows or lower highs can show trend direction, likely support or resistance, and where a trade idea starts to weaken.
That said, trendlines are not magic. Two traders can draw them slightly differently, and a clean line on a chart does not guarantee the next move. Used well, though, trendlines can help beginners stop guessing and start reading price with more discipline.
If you want a broader foundation first, read our guide to swing trading. For traders who want indicator-based confirmation alongside manual chart work, the AltAlgo Indicator is a practical next step.
What is a trendline trading strategy?
A trendline trading strategy uses straight lines on a chart to track the direction of price and identify areas where price may react. In an uptrend, traders draw a line under rising swing lows. In a downtrend, they draw a line across falling swing highs.
The basic idea is simple:
- an upward trendline can act like dynamic support
- a downward trendline can act like dynamic resistance
- a break of the line may suggest weakening momentum, not necessarily an instant reversal
This makes trendlines useful for planning entries, stop-loss placement, and trade invalidation. They are especially popular in crypto, forex, and index trading because they work across multiple timeframes.
Why beginners use trendlines

Beginners often struggle with one thing more than anything else: chart overload. Trendlines help reduce that noise.
Instead of staring at every candle, you focus on the market structure. Are buyers stepping in at higher levels? Are rallies getting sold sooner? A trendline gives you a visual framework for answering those questions.
- They simplify price action: you can spot trend direction faster.
- They improve discipline: you define where a setup makes sense and where it does not.
- They support risk management: stops can be placed beyond a logical structure level rather than at random.
- They combine well with other tools: moving averages, RSI, volume, and horizontal support/resistance all work well as confirmation.
That last point matters. Trendlines are best used as part of a process, not as a standalone shortcut.
How to draw trendlines correctly
Drawing trendlines sounds easy. Drawing useful trendlines is where traders usually go wrong.
- Start with clear swing points. Use obvious highs and lows, not tiny intraday wiggles that only make sense if you squint.
- Connect at least two points. A line needs two touches to exist, but three or more touches usually make it more meaningful.
- Do not force the line. If you have to bend logic to make price fit, the trendline probably is not valid.
- Use the same chart scale and timeframe. A trendline on the 4-hour chart may look irrelevant on the 5-minute chart, and that is normal.
- Treat zones realistically. Price often pierces a line slightly before reacting. Think in areas, not laser-precision pixels.
Many traders draw trendlines using candle wicks. Others prefer candle bodies for cleaner structure. Either approach can work if you stay consistent.
Uptrend example
If price forms a series of higher lows, draw a line beneath those lows. As long as price keeps respecting that line and the broader structure remains intact, buyers are still in control.
Downtrend example
If price forms lower highs, draw a line across those highs. Repeated rejection near that line suggests sellers are still defending the trend.
How traders use trendlines in real setups
A trendline becomes useful when it helps you make a decision. Most traders use it in one of three ways.
1. Buying pullbacks in an uptrend
In a healthy uptrend, price often pulls back toward the trendline before continuing higher. Some traders wait for a bounce, a bullish candle pattern, or confirmation from another indicator before entering.
The logic is straightforward: if the trend is intact, a pullback into support may offer a better risk-to-reward entry than chasing a breakout candle.
2. Selling rallies in a downtrend
The same idea works in reverse. In a downtrend, price may rally into a descending trendline and then reject. That can give traders a structured area to look for short entries, depending on the market and platform they trade.
3. Trading trendline breaks
Some traders focus on breaks rather than bounces. If price closes decisively through a well-respected trendline, it can signal that momentum is changing.
But this is where beginners get trapped. A trendline break does not automatically mean a full reversal. Sometimes it only means the trend is slowing down, or that price is rotating into a range.


That is why confirmation matters. Traders often combine a break with:
- a change in market structure
- higher volume
- a retest of the broken line
- support from indicators such as RSI or moving averages
Trendline strategy rules beginners can follow
If you are new to chart trading, keep the rules simple. Complexity usually arrives right before bad decisions.
- Trade with the higher-timeframe trend when possible.
- Only draw trendlines from obvious swing points.
- Wait for confirmation instead of entering on the first touch every time.
- Set your stop where the setup is invalidated, not where the loss feels emotionally comfortable.
- Risk a small, fixed percentage per trade.
- Journal screenshots of your trendline setups so you can review what actually worked.
If you want to build that broader technical foundation, our swing trading guide is a useful companion read.
Common mistakes with trendline trading
Most trendline mistakes come from trying to make the chart say what you want it to say.
- Forcing lines onto messy price action: not every market is trending cleanly enough for a trendline trade.
- Using only one timeframe: a perfect-looking setup on a low timeframe can run straight into higher-timeframe resistance.
- Treating every break as a reversal: many breaks lead to chop, not trend change.
- Ignoring horizontal levels: a trendline is stronger when it lines up with clear support or resistance.
- No risk plan: even a textbook setup can fail.
A good habit is to ask: would I still take this trade if the trendline were removed? If the answer is no, you may be relying on the line too much.
Pros and cons of a trendline trading strategy
Pros
- Easy to learn and apply
- Works across crypto, forex, stocks, and indices
- Helps define entries, exits, and invalidation clearly
- Pairs well with other technical tools
- Useful for both swing traders and shorter-term traders
Cons
- Subjective: different traders may draw different lines
- Less reliable in choppy or range-bound markets
- False breaks are common
- Can create overconfidence if used without confirmation
Trendlines vs other tools
Trendlines are best thought of as a structure tool. They show shape and direction. Other indicators can help confirm momentum, strength, or exhaustion.
- Moving averages: useful for smoothing trend direction and spotting dynamic support or resistance.
- RSI: helps gauge momentum and possible overbought or oversold conditions.
- Horizontal support and resistance: often more important than diagonal lines on their own.
- Volume: can help judge whether a breakout has real participation behind it.
If you want to improve your chart reading beyond trendlines, the support and resistance trading strategy and our moving average crossover strategy are natural next reads.
Are trendlines reliable?
Reliable enough to be useful. Not reliable enough to trade blindly.
That is the honest answer.
Trendlines work because markets often move in waves, and traders react to visible structure. Used with patience and risk control, trendlines can improve decision-making. Used as a promise of what price must do next, they become expensive decoration.
Final thoughts
A trendline trading strategy is one of the simplest ways to bring structure to a chart. For beginners, that matters. It helps you identify trend direction, plan trades around logical levels, and avoid random entries based on emotion.
The key is to keep expectations realistic. Draw clean lines, use higher-timeframe context, wait for confirmation, and manage risk on every trade. If you do that, trendlines can become a genuinely useful part of your trading process rather than just another line on the screen.
For traders who want extra confirmation alongside manual analysis, the AltAlgo Indicator can help filter setups with indicator-based signals. And if you want to keep building your chart-reading skills, start with our guide to swing trading.
FAQ
What is the best timeframe for trendline trading?
How many touches make a trendline valid?
Two touches are enough to draw a trendline, but three or more respected touches generally make it more meaningful. Even then, it should be treated as a guide rather than a guarantee.
Should beginners trade trendline breaks or bounces?
Bounces are often easier for beginners to understand because they align with the existing trend. Breaks can work too, but they produce more false signals and usually need stronger confirmation.
Can trendlines be used in crypto and forex?
Yes. Trendlines are widely used in crypto and forex because they are based on price structure rather than a specific asset class. The same principles apply, although volatility can make false breaks more common in fast-moving markets.










There is no single best timeframe. Higher timeframes such as 4-hour and daily charts usually produce cleaner trendlines, while lower timeframes create more noise and more false breaks. Many traders use a higher timeframe for direction and a lower timeframe for entries.