

Simple moving average (SMA) vs exponential moving average (EMA) sounds like a small technical detail, but it changes how you read a chart. Both indicators smooth price action. The difference is in how fast they react.
An SMA gives equal weight to every price in the selected period. An EMA gives more weight to recent prices, so it responds faster when the market starts to move.
That means neither is “better” in every situation. The better choice depends on your timeframe, your strategy, and how much noise you are willing to tolerate.
If you are still building your chart-reading basics, it helps to start with a broader technical analysis guide before getting too deep into indicator settings.
Disclaimer: The information shared by AltSignals and its writers is for educational purposes only and should not be considered financial advice. We are not responsible for any investment decision you make after reading this post. Never risk more than you can afford to lose, and consider speaking with a qualified financial adviser.
What is a simple moving average (SMA)?
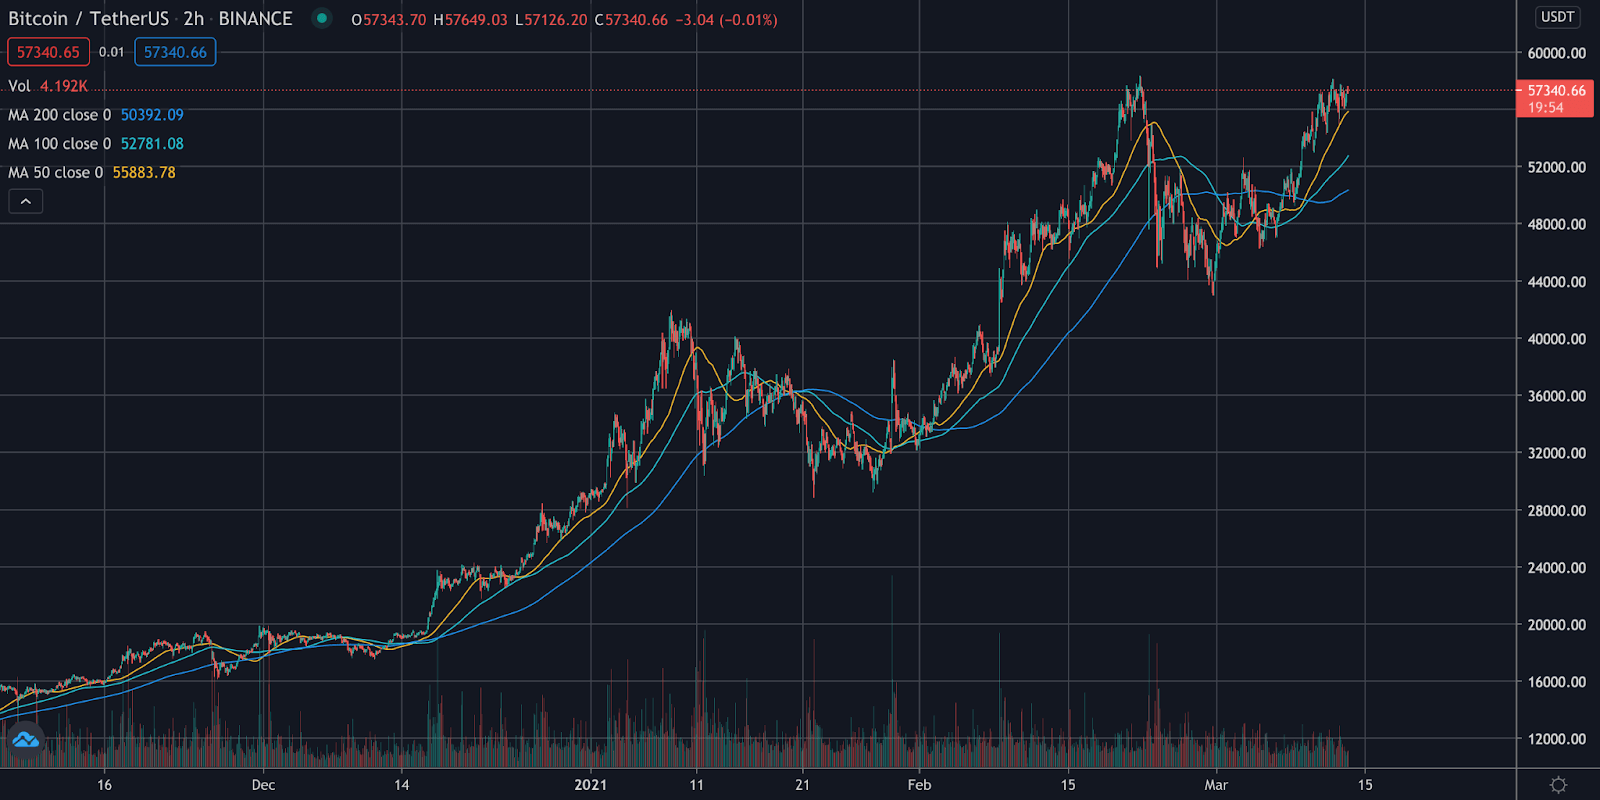
A simple moving average takes the average closing price of an asset over a set number of periods. If you use a 20-day SMA, you add the last 20 closing prices together and divide by 20.
Because every data point is weighted equally, the SMA tends to move more slowly than an EMA. That makes it useful when you want a cleaner view of the broader trend rather than every short-term wobble.
Traders often use SMAs to:
- identify the overall direction of a trend
- spot dynamic support or resistance areas
- compare short-term and long-term trend strength
- filter out some market noise
Common settings include the 20, 50, 100, and 200-period SMA. On higher timeframes, the 200-period SMA is widely watched because it gives a simple view of the longer-term trend.
What is an exponential moving average (EMA)?
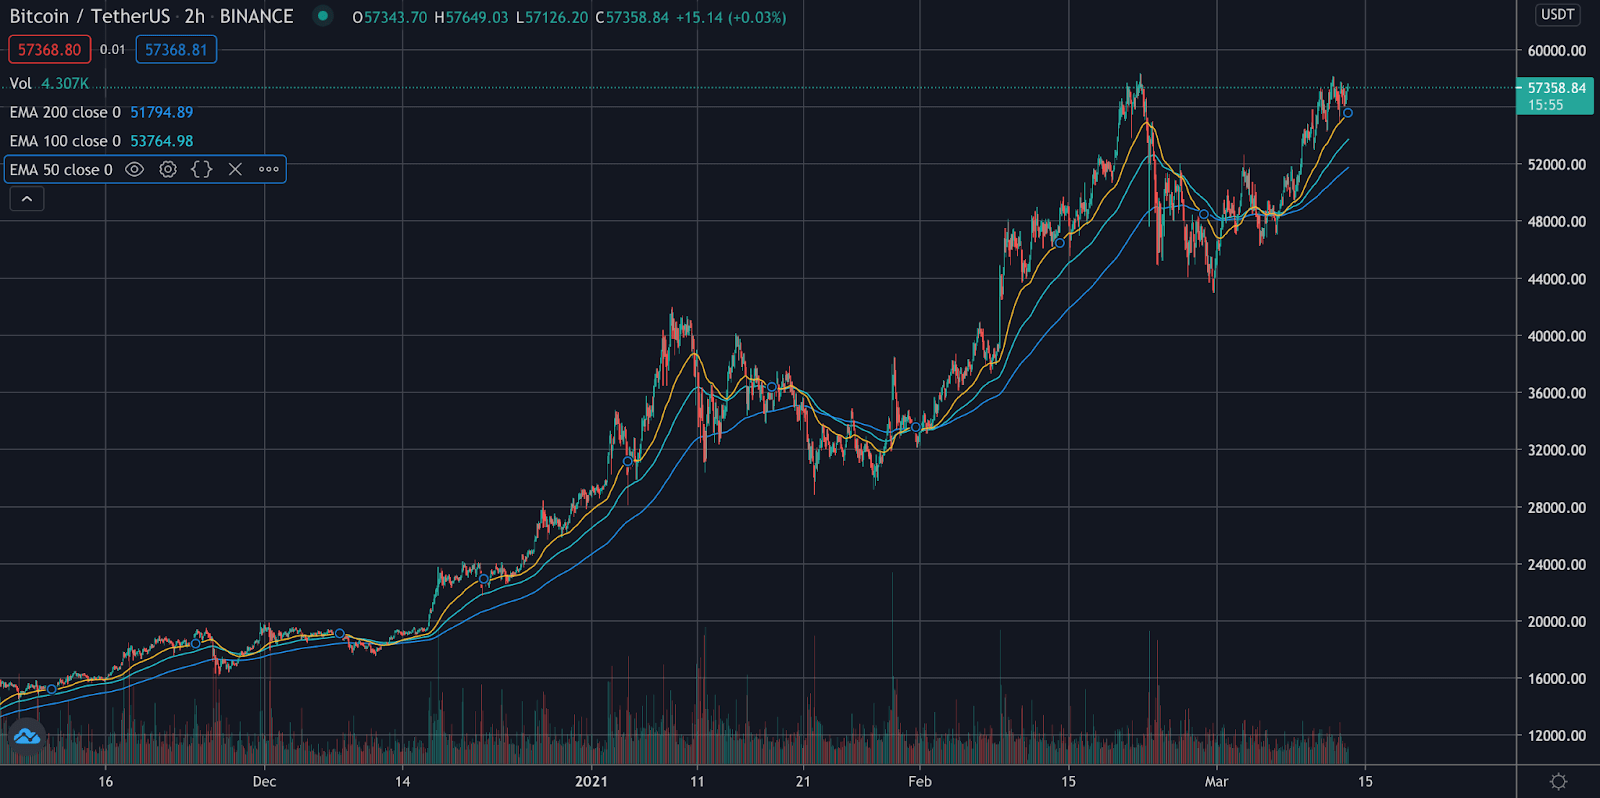
An exponential moving average also tracks the average price over a chosen period, but it gives more importance to the most recent candles. That extra weighting makes the EMA more responsive to fresh price action.
In practice, the EMA will usually turn faster than an SMA when momentum shifts. That is why many short-term traders prefer EMAs for entries, pullbacks, and trend continuation setups.
Traders often use EMAs to:
- react faster to changing momentum
- track short-term trends more closely
- build crossover strategies
- follow pullbacks in trending markets
Popular EMA settings include the 9, 12, 20, 50, and 200-period EMA. Shorter EMAs are more reactive, but they also produce more false signals when the market is choppy.
SMA vs EMA: the key difference
The core difference is simple:
- SMA: every period has equal weight
- EMA: recent prices have more weight
That one change affects almost everything else.
An SMA is smoother and slower. An EMA is faster and more sensitive. If price suddenly reverses, the EMA will usually react first. If price is messy and range-bound, the SMA will often look cleaner and less jumpy.
This is why traders often use SMA and EMA for different jobs rather than treating them as direct rivals.
Simple moving average vs exponential moving average: which is better?
There is no universal winner.
If you want a steadier view of trend direction, the SMA is often the better fit. If you want quicker signals and tighter alignment with recent price action, the EMA usually makes more sense.
As a rough rule:
- Use SMA when you care more about smooth trend structure than speed
- Use EMA when you care more about responsiveness than smoothness
That is why longer-term investors often watch major SMAs, while active traders often build setups around shorter EMAs.
When traders prefer the SMA
The SMA is commonly used when the goal is to reduce noise and focus on the bigger picture.
It can be useful for:
- longer-term trend analysis
- position trading
- higher-timeframe chart reviews
- confirming whether price is broadly above or below a major average
For example, a trader looking at the daily chart may use the 200-day SMA to judge whether an asset is in a broader uptrend or downtrend. It will not catch every turn early, but that is not really its job.
When traders prefer the EMA
The EMA is often preferred when timing matters more.


It can be useful for:
- swing trading
- trend-following setups
- pullback entries
- shorter-term momentum analysis
For example, a swing trader may use the 20 EMA or 50 EMA to track whether price is respecting a trend. Because the EMA reacts faster, it can help spot changes in momentum earlier than an SMA. The trade-off is that it can also produce more fake-outs.
If swing trading is your focus, you may also want to read our guide on what swing trading is.
Do moving average crossovers actually work?
Moving average crossovers are popular because they are easy to spot. A shorter moving average crossing above a longer one can suggest strengthening momentum. A cross below can suggest weakening momentum.
That said, crossovers are not magic. In strong trends they can be useful confirmation tools. In sideways markets they can become a machine for false signals.
Two practical points matter here:
- the longer the moving averages, the slower the signal
- the shorter the moving averages, the more noise you will get
So if you use crossovers, it usually helps to combine them with market structure, support and resistance, or another confirmation tool instead of trading every cross blindly.
Common mistake: using one indicator for every market condition
This is where many traders get tripped up.
Neither SMA nor EMA works equally well in every environment. Trending markets and range-bound markets behave differently. A fast EMA can look brilliant during a clean trend and terrible during chop. A slower SMA can keep you grounded during noise, but it may react too late for short-term entries.
That is why experienced traders usually choose moving averages based on:
- the asset they trade
- the timeframe they use
- whether the market is trending or ranging
- whether they need confirmation or early reaction
SMA vs EMA for crypto, forex, and stocks
The logic is the same across markets, but the way traders use these indicators can differ.
Crypto: because crypto can move quickly and trade around the clock, many traders lean on EMAs for faster trend tracking.
Forex: both SMA and EMA are widely used, depending on whether the trader is following intraday momentum or higher-timeframe structure.
Stocks: longer SMAs such as the 50-day and 200-day averages are commonly watched for broader trend analysis, while shorter EMAs are often used for active trading.
The market matters, but your method matters more.
Final thoughts
The simple moving average and exponential moving average do the same basic job: they smooth price data so trends are easier to read. The difference is that the SMA is slower and steadier, while the EMA is faster and more reactive.
If you want a cleaner long-term view, start with the SMA. If you want quicker feedback from recent price action, the EMA is usually the better tool.
Most traders eventually use both. One helps with structure. The other helps with timing.
If you want help combining indicators into a more practical trading workflow, the AltAlgo indicator is worth exploring. If you trade very short-term moves, our guide to scalp trading can help show why moving averages are only one piece of the puzzle.
FAQ
Is EMA more accurate than SMA?
Why do traders use the 50-day and 200-day moving averages?
These longer settings are widely watched because they help show the broader trend. Many traders use them as reference points for trend direction, support and resistance, and major crossover signals.
Should beginners use SMA or EMA?
Beginners often find SMA easier to understand because it is smoother and simpler to read. EMA becomes useful once you want faster signals and have a clearer grasp of how market noise affects entries.
Can you use SMA and EMA together?
Yes. Many traders use an SMA for the bigger trend and an EMA for shorter-term timing. That combination can help balance clarity with responsiveness.


Not automatically. EMA reacts faster to recent price changes, which can make it feel more accurate in trending markets. But that same sensitivity can create more false signals in choppy conditions.