In this guide, you will know which are the top three trend indicators to trade cryptocurrencies. You will be able to use these indicators not only for the crypto market but also for Forex trading. This is going to make it easy for you to understand whether we are experiencing a bull trend, a bear trend or we are in the middle of a trend change.
Understanding trading tools and indicators would provide us with more information to trade these assets. This is why these top 3 trend indicators to trade cryptocurrencies would be very helpful.
If you want to learn more about trading, you can learn about Bitcoin Margin Trading.
Disclaimer: this post should not be considered investment advice. This is only for educational purposes only. Never invest more than what you are able to lose and always ask for information to your professional financial advisors. We are not financial advisors.
Moving Averages (MA)
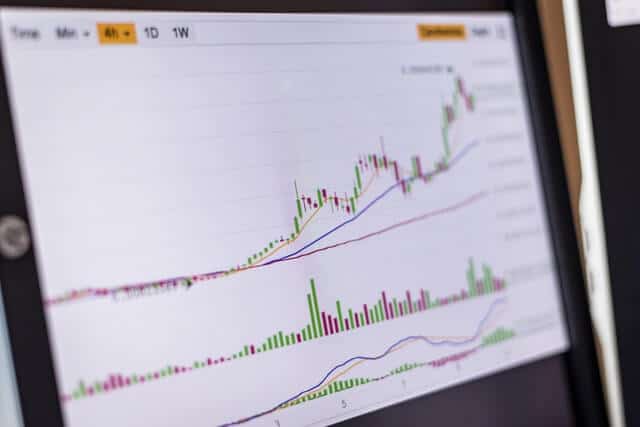
Moving averages are very important to understand the direction of a specific trend in both forex and the cryptocurrency market. They help us get valuable information on whether a specific trend is bullish or bearish using just two simple moving averages.
The good thing about the MA is that you can select the periods for which these MA are working. Nonetheless, the market has very clear and defined periods that it uses to trade virtual currencies.
When we have a rising MA, we are in an uptrend market. We should consider this is a bullish period for the cryptocurrency we are trading. If instead, the MA falls and goes downwards, then we should consider this a downtrend.
This would help us “buy the dips” or simply sell the tops. We can combine these moving averages with trendlines that would give us more information about the fluctuation of an asset. The MA allows users to determine support and resistance levels.
Take into consideration when the short-term MA crosses the long-term MA into higher levels, we consider this a bullish cross. If we see the short term MA is crossing the long-term MA into lower prices, then, this can be considered a sell signal or that downtrend momentum is building.
Moving Average Convergence Divergence (MACD)
The Moving Average Convergence Divergence (MACD), is also one of the most popular trend indicators used by large and small traders all over the world. This is very useful to understand how trends are moving and working.
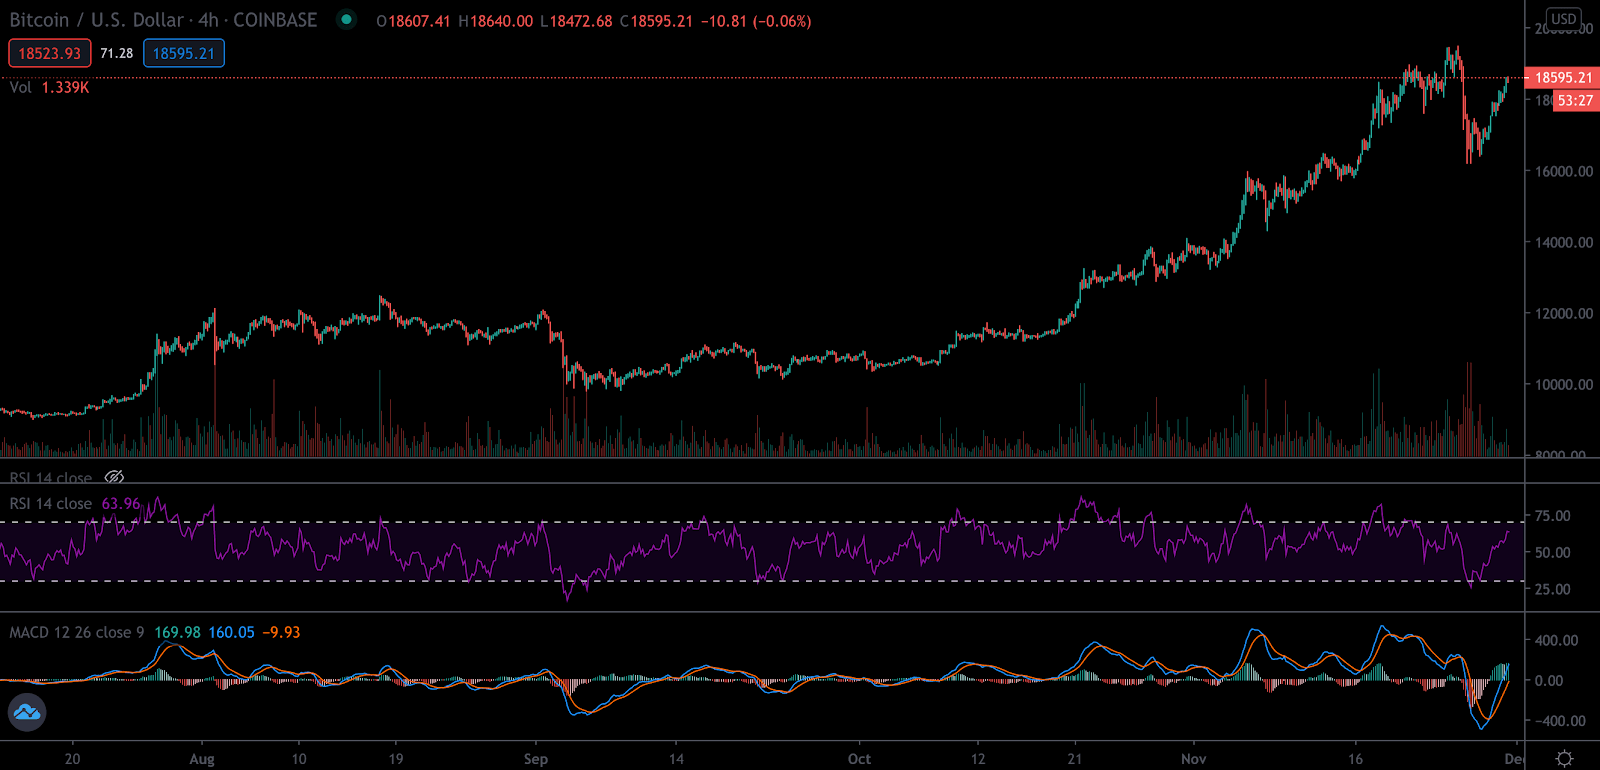
For traders that are searching for buying and selling signals, the MACD is going to be very useful. It triggers signals when it crosses the signal line. When the signal line gets crossed downwards, this is a bearish cross that is showing us that there is a bearish momentum in the market. If instead, the signal line gets crossed upwards, we are entering a bullish trend.
The MACD indicator allows users to understand whether the bullish or bearish trend in which they are, is strengthening or weakening. This is definitely important to start planning different strategies according to the direction of the market.
When the distance between the signal line and the moving average line increases, we could say that the trend is strengthening. It does not matter if upwards or downwards. Instead, if the two lines get closer, then the trend is weakening. Of course, the trend can change at any moment and even if it was weakening it could become stronger later.
Ichimoku Cloud
The Ichimoku Cloud is one of the most interesting Top 3 Trend Indicators To Trade Cryptocurrencies. This trading tool provides us with a lot of information, including support and resistance levels, the strength of the trends and the direction of these trends.
If the price of an asset is below the “cloud,” then we can say that the trend is moving downwards. If instead, the price is moving above the cloud, we can consider we are in a bullish trend.
It is worth taking into consideration that the trend is strengthening if the cloud is getting bigger and moving in the same direction as the price. This shows that it is possible for the trend to continue in this way. We do not only have an idea of the trend but also how strong it is.
Furthermore, the first line between the price and the cloud is going to be working as a support or resistance level. The same will happen with the second line if the first is broken. This applies both to upward movements or downward trends.


