Crypto traders rarely rely on a single indicator. The better approach is to use a small set of tools that help you read trend, momentum, volatility, and confirmation together. If you keep it simple, four indicators cover most of what you need: RSI, Bollinger Bands, moving averages, and volume.
Used properly, these indicators can help you spot stronger setups, avoid weak breakouts, and manage entries with more structure. They are still guides rather than guarantees, which is why it helps to combine them with price action, support and resistance, and risk management. If you want a broader foundation first, this crypto trading guide is a good place to start.
Top 4 indicators to trade cryptocurrencies
1. Relative Strength Index (RSI)
The Relative Strength Index, or RSI, is one of the most widely used momentum indicators in crypto. It measures the speed and size of recent price moves on a scale from 0 to 100, which helps traders judge whether a market may be stretched in one direction.
The classic reading is simple: below 30 is often treated as oversold, while above 70 is often treated as overbought. That does not mean price must reverse immediately. In strong trends, RSI can stay elevated or depressed for longer than many beginners expect. What it does well is highlight when momentum is becoming extreme.
RSI is especially useful for pullbacks, range trading, and spotting possible momentum divergence. For example, if price makes a higher high but RSI fails to do the same, that can be an early warning that bullish momentum is weakening. On the other side, if price makes a lower low while RSI holds up better, sellers may be losing strength.

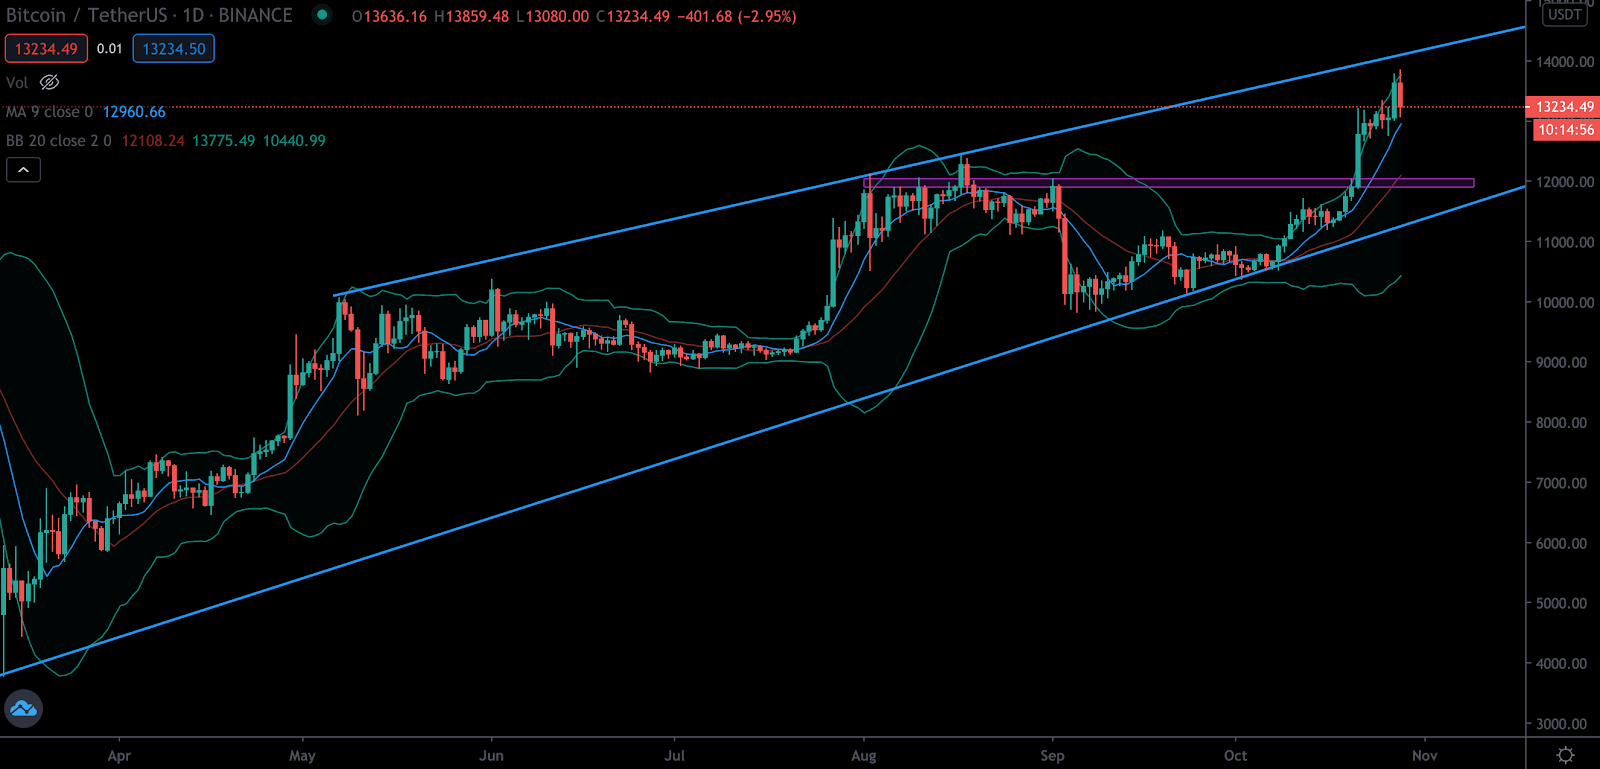
2. Bollinger Bands
Bollinger Bands are useful when you want to understand volatility. The indicator consists of an upper band, a middle moving average, and a lower band. As volatility expands, the bands widen. As volatility contracts, they narrow.
That makes Bollinger Bands helpful for two common situations. First, they can show when price is pushing toward an extreme relative to its recent average. Second, they can highlight volatility compression, which often comes before a larger move. Traders sometimes call this a squeeze.
One mistake is assuming that touching the upper band always means sell, or touching the lower band always means buy. In strong crypto trends, price can ride one band for a while. It is usually better to treat the bands as context rather than a standalone signal. They work best when paired with momentum or volume confirmation.
3. Moving Averages
Moving averages are among the simplest indicators on any chart, but they remain useful because they help clean up noisy price action. They smooth price over a chosen period and make trend direction easier to read.
Shorter moving averages react faster and are often used by short-term traders. Longer moving averages move more slowly and can help define the broader trend. Many traders watch how price behaves around the 20, 50, 100, or 200-period average, depending on timeframe and strategy.
Moving averages can also act as dynamic support or resistance. If price keeps pulling back into a rising average and bouncing, that can support a bullish trend view. If a falling average keeps rejecting price, that can reinforce a bearish one. Crossovers are another common use. When a shorter-term moving average crosses above a longer-term one, traders often treat that as bullish confirmation. When it crosses below, it can suggest momentum is weakening. Even so, crossovers tend to lag, so they are usually more useful as confirmation than as an early entry trigger.

4. Trading Volume
Volume is often overlooked by newer traders, but it is one of the best confirmation tools on the chart. It shows how much participation sits behind a move.
If price breaks higher but volume stays weak, the breakout may be less reliable. If price pushes through resistance with a clear increase in volume, that move usually carries more weight. The same logic applies in reverse during selloffs.
Volume is also useful around key levels. A bounce from support with rising volume can suggest buyers are stepping in. A breakdown below support with heavy volume can suggest stronger conviction from sellers. On its own, volume does not tell you direction in advance, but it helps you judge whether the market is backing the move you are seeing.
Other trend indicators traders often use
The four indicators above are enough for most traders, but they are not the only useful tools on a crypto chart. Two common additions are MACD and Ichimoku Cloud. They can be helpful if your focus is trend strength and confirmation, though they also add more complexity.


MACD
The Moving Average Convergence Divergence indicator, or MACD, is popular because it blends trend and momentum in one tool. Traders usually watch for the MACD line crossing the signal line, along with the histogram expanding or contracting.
If the MACD line crosses above the signal line, that can point to improving bullish momentum. If it crosses below, it can suggest bearish momentum is building. The distance between the lines also matters. When separation increases, momentum is often strengthening. When the lines start to converge again, the move may be losing force.
MACD tends to work best as confirmation rather than a standalone trigger. It is especially useful when it agrees with price structure, moving averages, and volume.
Ichimoku Cloud
Ichimoku Cloud gives a broader view of trend direction, momentum, and possible support or resistance in one layout. That makes it powerful, but also harder to read at first than simpler indicators.
A basic interpretation is straightforward. If price is above the cloud, traders often treat that as bullish context. If price is below the cloud, the trend is usually considered bearish. The cloud itself can also act as an area of support or resistance rather than a single line.
Some traders also watch the thickness of the cloud. A thicker cloud can suggest stronger support or resistance and a more established trend backdrop, while a thinner cloud may be easier for price to break through. Like MACD, Ichimoku is usually more useful when it supports what price action is already showing instead of replacing it.
How to combine these indicators
The real value comes from using indicators together instead of stacking random tools on a chart. A simple workflow might look like this:
- Use moving averages to define the broader trend.
- Use RSI to judge momentum and whether price is stretched.
- Use Bollinger Bands to read volatility and possible expansion points.
- Use volume to confirm whether the move has participation behind it.
If you want extra confirmation, MACD can help you judge whether momentum is strengthening or fading, while Ichimoku can give a wider trend view. Just avoid loading too many indicators that tell you the same thing in slightly different ways.
For example, if price is above a rising moving average, RSI pulls back from overbought without breaking down, Bollinger Bands begin to expand again, and volume increases on the next push higher, that is a much cleaner setup than relying on one signal alone.
Where the AltSignals indicator fits
Many traders use standard indicators for context and then add a dedicated tool to simplify execution. The AltAlgo indicator is built for that kind of workflow. Rather than replacing chart reading entirely, it can help traders identify bullish and bearish phases more quickly and reduce some of the guesswork around timing.
If you prefer a more hands-off way to follow setups instead of building everything manually, you can also explore AltSignals trading signals. If you want extra transparency before trying any service, you can review recent trading results. As always, indicators and signals work best when they are part of a disciplined plan rather than a shortcut to guaranteed results.
Final thoughts
If you are choosing just four indicators for crypto, RSI, Bollinger Bands, moving averages, and volume give you a balanced starting point. They cover momentum, volatility, trend, and confirmation without making your chart unreadable.
MACD and Ichimoku Cloud are also worth knowing because they can add another layer of trend analysis, but they are optional rather than essential for most traders. Keep the process simple, test your setups over time, and avoid treating any indicator as a promise. The goal is not to predict every move. It is to make better decisions with better context.