Although the crypto market seems to be turning bullish, crypto traders always want to know what could happen to their investments and how to stop bearish and bullish patterns in the charts. In this article, we will share the top 5 bearish patterns that users should always pay attention to if they see one on their charts. At the same time, we will also tell you how to improve your trading strategies by using AltSignals, one of the best crypto trading signals providers in the market.
Evening Star Trading Pattern
Although this is not a trading pattern per se, it will be a great indicator to understand whether it is a good moment to enter or exit a position in the market. This pattern gets formed in a candlestick chart in which there should be one large and green candle, followed by a small red candle that does not touch the real body of the first candle. The third candle will then be a green candle that will have a large body, similar to the first one. This pattern should be a great way to understand whether there is a good moment to sell or leave a position. This is what AltSignals experts and analysts are doing when they provide technical analysis to users. They understand where these patterns appear to provide great insight related to the crypto market.
Hanging Man Crypto Trading Pattern
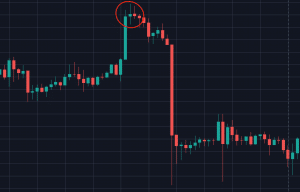
This candlestick pattern is also very important for traders that are currently in the crypto market. Indeed, this pattern This could also apply to bullish moments when a bear market is reaching a point of inflexion. This pattern is represented by three candles. The first one is positive with a green medium to large body followed by a red candle that will have a small body with a long shadow. This appears at the top of a trend and, as mentioned before, this would represent a change in the trend, from bullish to bearish.

(Image provided by commodity.com)
Hammer Candlestick
This is similar to the previously mentioned pattern. In this case, there will be three candles as in a traditional chart. There will be a candle between two others that would have a very long shadow and a small body in the lower part. In general, it is important to understand why this happened by taking into account the volume that played out in this formation. The higher the volume, the higher the probabilities of having an inflexion point in the market.
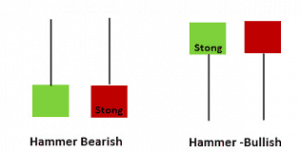
(Image provided by onestepermoved.com)


Head and Shoulders
This is one of the most known trading patterns in the cryptocurrency market. This pattern shows that the market is moving from bullish to bearish. One of its main characteristics is having three bullish momentum with two valleys in the middle. It is called Head and Shoulders or H&S because there is a major bull movement between to minor bullish “armpits.” This major bullish trend shows the “head” of the pattern. When the pattern is completed, it is possible to exit the market and be sure the trend will continue downwards most of the times. As the buyers move away and the sellers increase their pressure this could turn out being a very profitable pattern.
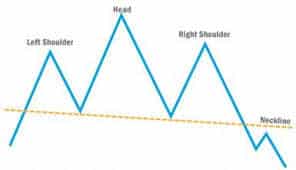
(Image provided by schwab.com)
Double / Tripple Tops
If you see that the market is moving higher and there is a moment the charts show it is difficult to break a resistance level, then you should be careful. Three or two tops could be taken as a bearish sign considering the bullish traders are not able to surpass the barrier of sellers at this specific price point. The best thing to do is to always have a plan if the market arrives at such a point. It is worth mentioning that this doesn’t mean 100% that the market will turn bearish, but it is always important to take this into account.
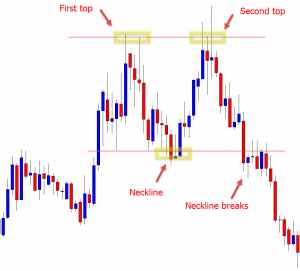
(Image provided by Forex School Online)
Conclusion
In this article, we aimed at showing you which are some of the most bearish patterns in the cryptocurrency market and how they could affect the way in which you trade virtual currencies. Although not all of them will mean 100% the market is transforming itself into bearish, it is always important to take them into account to plan our strategies. These patterns could be a good indicator of when to leave or exit the market.