Most traders eventually learn the same lesson: one indicator on its own rarely tells the full story. A moving average can show trend, RSI can show momentum, and Fibonacci can highlight possible reaction zones, but none of them should be treated like a magic button.
This guide breaks down five of the most widely used trading indicators, what they actually measure, and how traders use them in practice across crypto, forex, and other markets. If you want the broader framework behind these tools, start with our technical analysis guide.
Disclaimer: This article is for educational purposes only and should not be considered financial advice. Markets are risky, and no indicator guarantees profitable trades. Never risk more than you can afford to lose.
1. Moving Average (MA)
A moving average smooths price data over a chosen period, making it easier to spot the underlying trend. Instead of reacting to every candle, traders use MAs to see whether price is generally moving up, down, or sideways.
The two most common versions are:
- Simple Moving Average (SMA): gives equal weight to each data point in the period
- Exponential Moving Average (EMA): gives more weight to recent prices
Common settings include 20, 50, 100, and 200 periods. Shorter averages react faster but produce more noise. Longer averages are slower, but often better for identifying the bigger trend.
Traders often use moving averages to:
- identify trend direction
- spot dynamic support and resistance
- watch for crossovers between short and long averages
For example, if price is consistently holding above a rising 50-day moving average, many traders read that as a sign of trend strength. If price starts closing below it repeatedly, that can suggest momentum is fading.
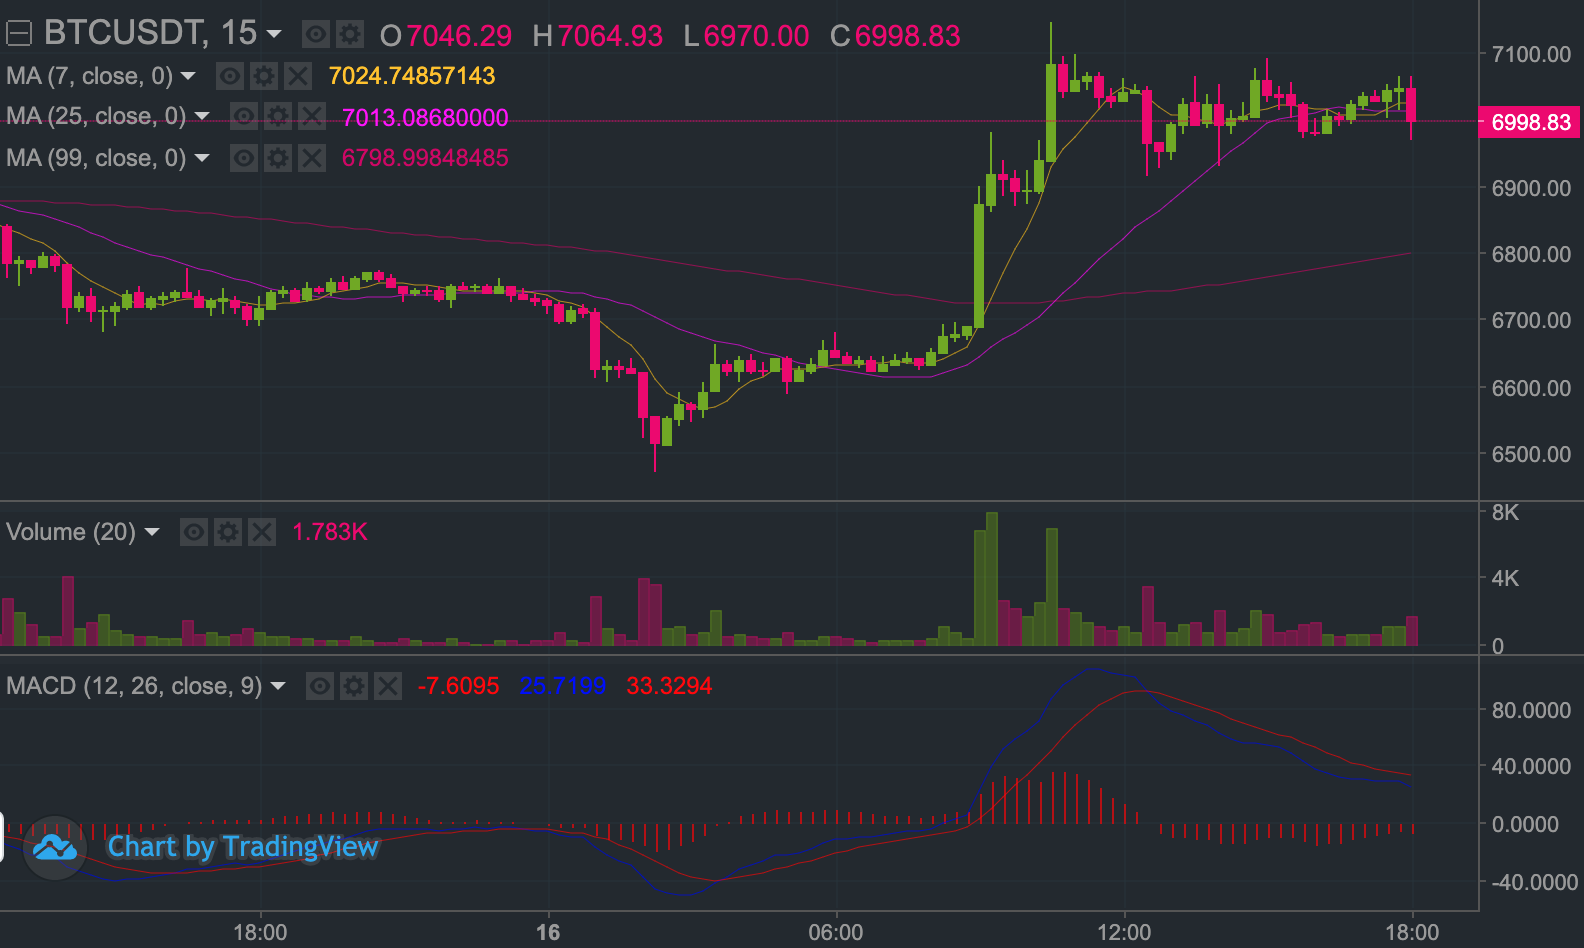
2. MACD
MACD stands for Moving Average Convergence Divergence. It is a trend-following momentum indicator built from exponential moving averages, usually the 12-period EMA and 26-period EMA.
The MACD has three main parts:
- MACD line: the difference between the 12 EMA and 26 EMA
- Signal line: a moving average of the MACD line
- Histogram: shows the distance between the MACD line and signal line
Traders use MACD to look for:
- bullish or bearish momentum shifts
- crossovers between the MACD line and signal line
- divergence between price and momentum
A bullish crossover happens when the MACD line moves above the signal line. A bearish crossover is the opposite. That said, MACD tends to work better in trending markets than in choppy ranges, where false signals can pile up quickly.
If you want to avoid relying on one signal in isolation, it helps to combine MACD with structure, trend, and risk management. Our guide on things to avoid while trading cryptocurrencies covers some common mistakes.
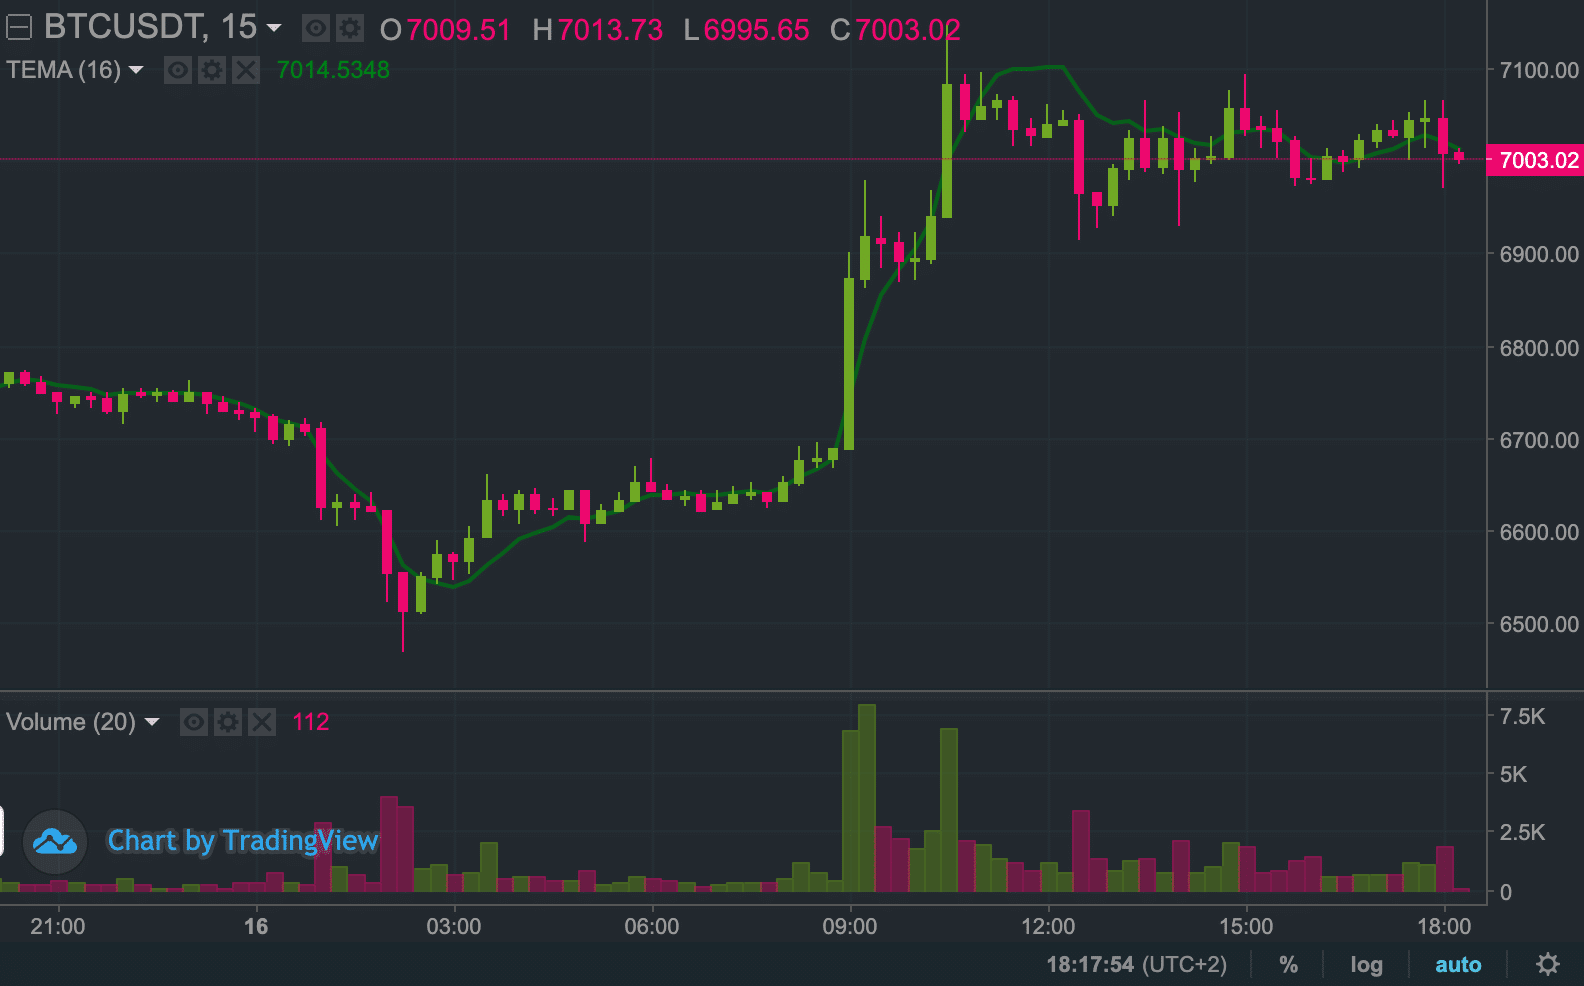
3. Exponential Moving Average (EMA)
The EMA deserves its own spot because many traders prefer it over the simple moving average for short-term decision-making. Since it gives more weight to recent price action, it reacts faster when the market changes direction.
That extra sensitivity is useful, but it comes with a trade-off: EMAs can also produce more false signals during noisy conditions.
Popular EMA combinations include:
- 9 and 21 EMA: often used by short-term traders
- 12 and 26 EMA: commonly tied to momentum analysis and MACD
- 50 and 200 EMA: widely used for higher-timeframe trend analysis
Many traders use EMAs as a framework rather than a trigger. For example, they may only look for long setups when price is above the 50 EMA and the 200 EMA is sloping upward. That keeps them trading with the broader trend instead of fighting it.
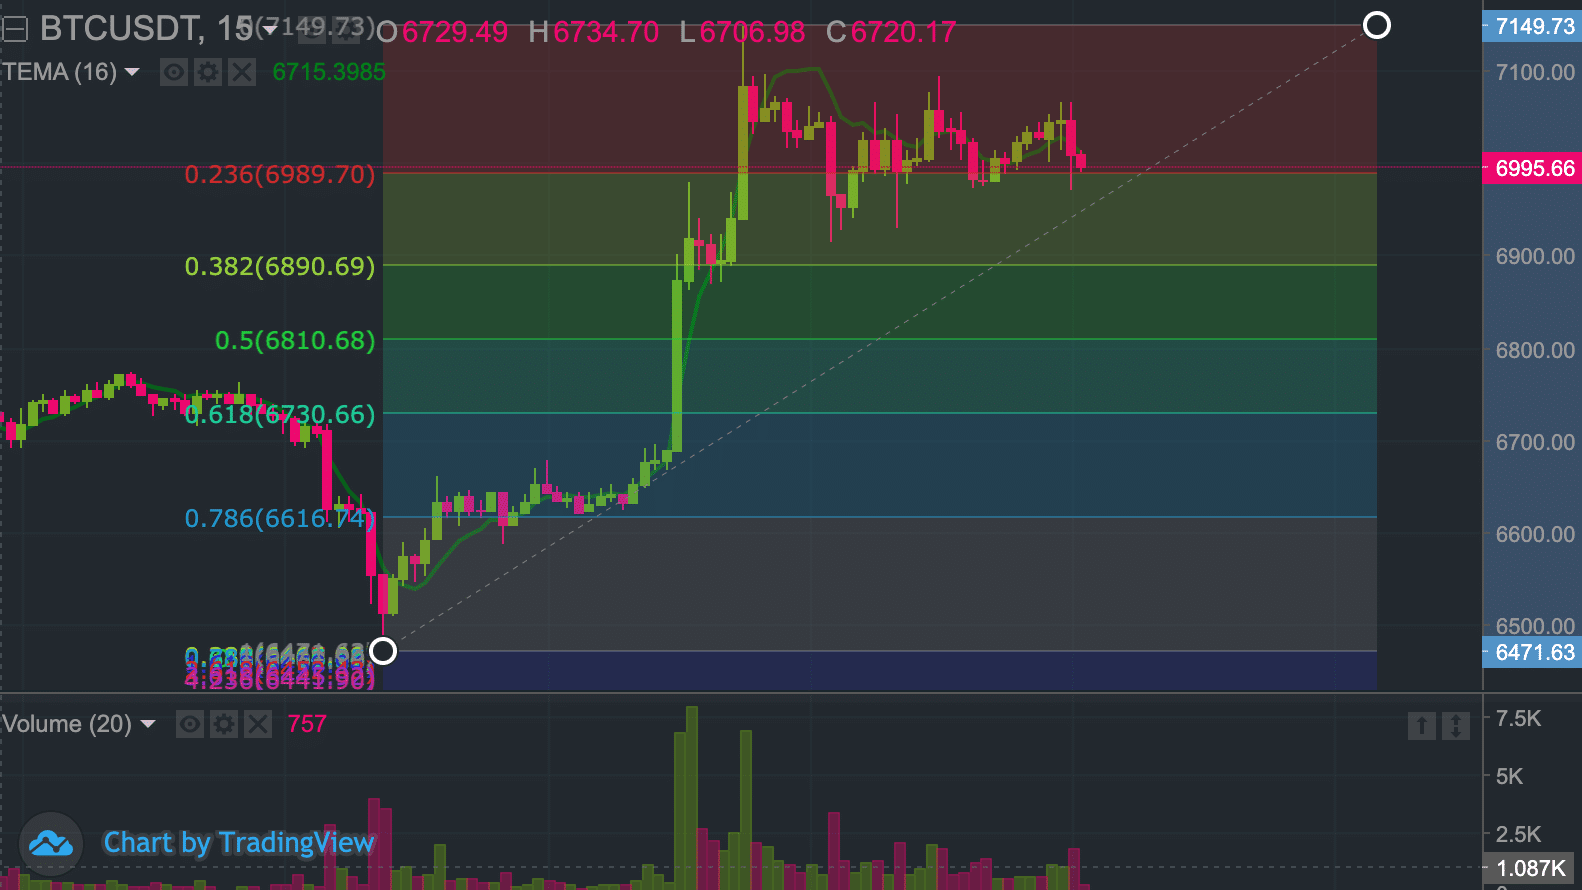
4. Fibonacci Retracement
Fibonacci retracement is used to map potential pullback levels after a strong move. Traders draw the tool from a swing low to a swing high in an uptrend, or from a swing high to a swing low in a downtrend, to identify areas where price might pause or reverse.


The most watched retracement levels usually include:
- 23.6%
- 38.2%
- 50%
- 61.8%
- 78.6%
These levels are not guarantees. They are best treated as areas of interest, especially when they line up with other factors such as horizontal support and resistance, trendlines, or moving averages.
For example, if a market is trending higher and pulls back into the 38.2% or 61.8% zone while also holding above a key EMA, some traders will watch that area closely for confirmation rather than entering blindly.
Used well, Fibonacci helps with structure. Used badly, it becomes chart decoration with extra steps.
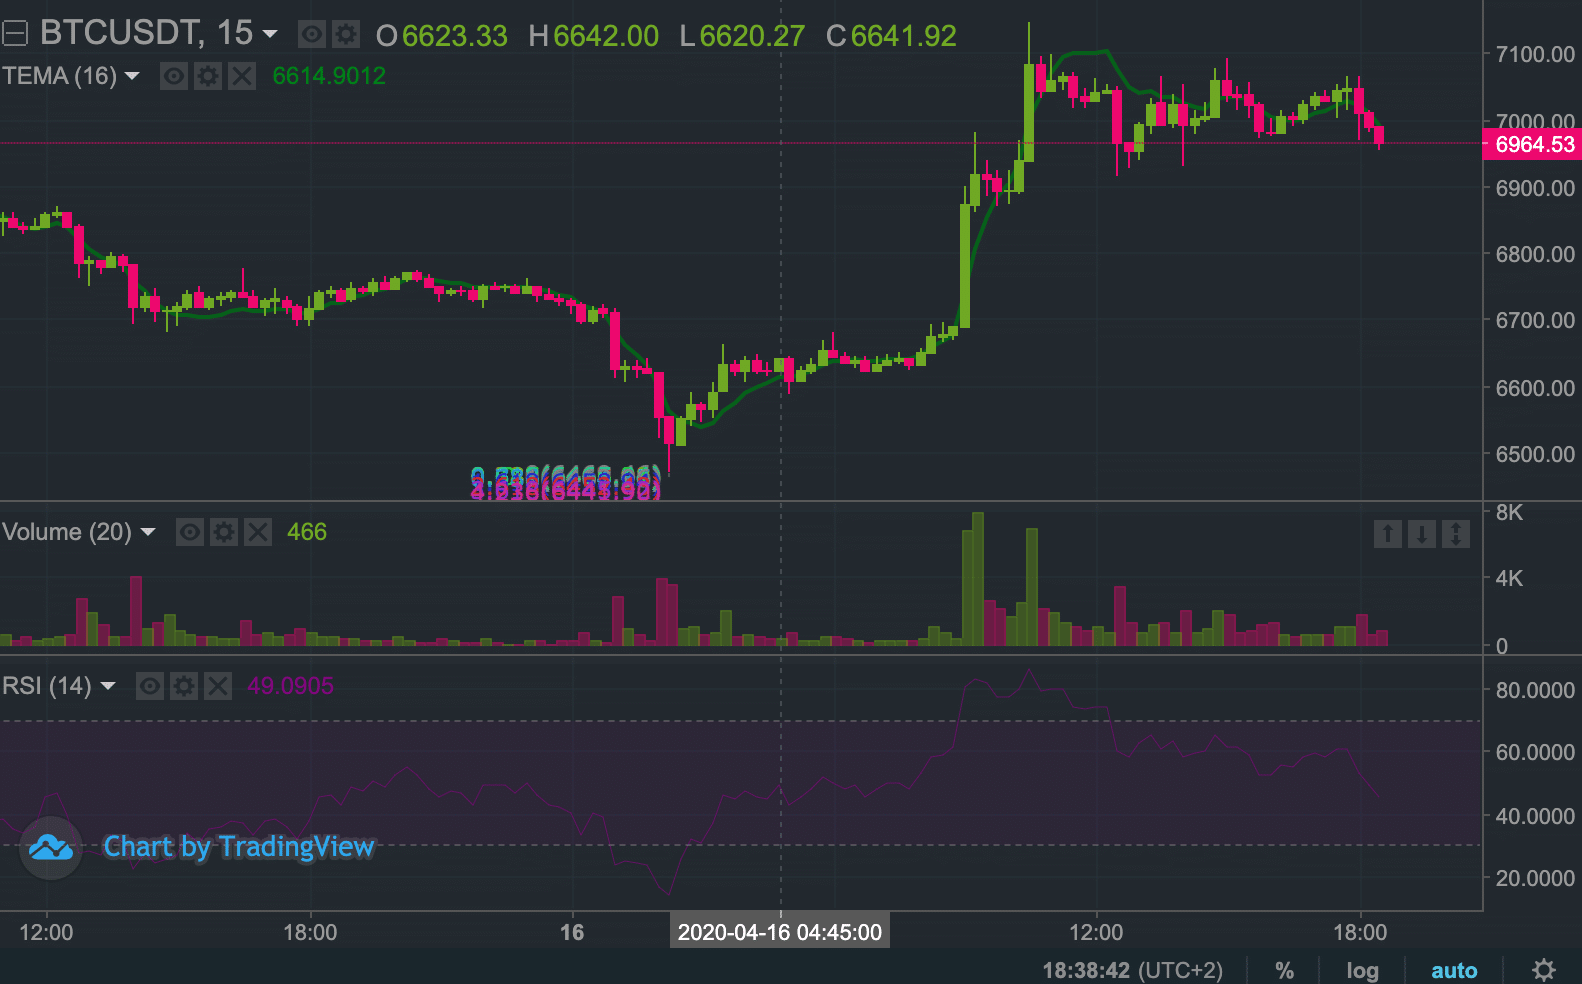
5. Relative Strength Index (RSI)
The Relative Strength Index, or RSI, is a momentum oscillator that moves between 0 and 100. It is commonly used to assess whether an asset may be overbought, oversold, or simply losing momentum.
The classic interpretation is:
- Above 70: potentially overbought
- Below 30: potentially oversold
- Between 30 and 70: neutral range
That sounds simple, but context matters. In strong uptrends, RSI can stay above 70 for longer than many beginners expect. In strong downtrends, it can remain weak for extended periods. So an overbought reading does not automatically mean “sell now,” and an oversold reading does not automatically mean “buy now.”
RSI becomes more useful when traders look for:
- momentum confirmation
- bullish or bearish divergence
- range-trading conditions where reversals are more likely
If you trade crypto specifically, pairing RSI with market structure and volatility matters even more because fast moves can make standalone oscillator signals unreliable.
How traders combine these indicators
The best use of indicators is usually complementary, not repetitive. Stacking five versions of the same idea on one chart does not make the analysis better. It just makes the chart harder to read.
A cleaner approach is to combine tools that answer different questions:
- Trend: MA or EMA
- Momentum: RSI or MACD
- Structure: Fibonacci retracement or horizontal support and resistance
A simple example might look like this:
- price is above the 200 EMA, so the broader trend is up
- price pulls back into a Fibonacci zone near prior support
- RSI cools off from overbought levels without breaking down
- MACD starts turning back up
That does not guarantee the trade works. It just gives a more structured reason for taking it.
Final thoughts
The most useful trading indicators are the ones you understand well enough to use consistently. For many traders, that means starting with a small toolkit rather than covering the chart in every indicator available.
Moving averages, EMA, MACD, Fibonacci retracement, and RSI remain popular because they help traders read trend, momentum, and structure without overcomplicating the process. The edge comes from how you combine them with risk management, timeframes, and discipline.
If you want a more hands-on way to apply technical analysis, you can also explore the AltAlgo indicator for trade ideas and confirmation alongside your own chart work.