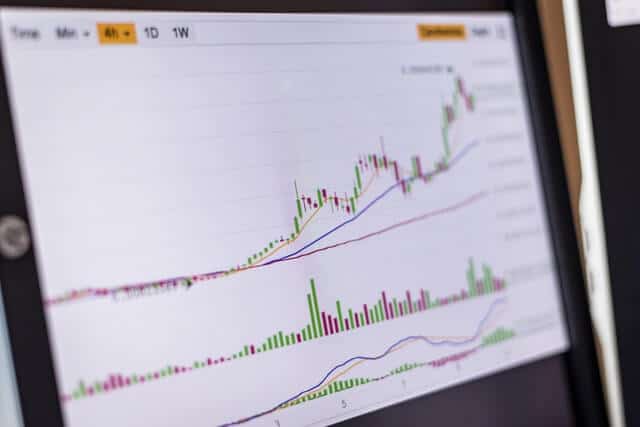
When we trade in any of the markets available, we tend to use indicators, patterns and fundamentals. The goal is to understand how the market could continue moving. Although the analysis we do is far from perfect, it gives us an idea of possible market movements in different periods of time.
Understanding what are chart patterns, how they work and how to spot them is certainly important. Furthermore, with this guide, you will also know how to draw them and on which platforms.
Disclaimer: the information shared by AltSignals and its writers should not be considered financial advice. This is for educational purposes only. We are not responsible for any investment decision you make after reading this post. Never invest more than what you are able to lose. Always contact your professional. financial advisor.
What are Traditional Chart Patterns?
A chart pattern makes reference to price movements in the market that analysts use in order to better understand the situation of an asset. Patterns tend to repeat themselves over time, in different time frames and using different assets or markets.
There are different types of chart patterns. These types of patterns include traditional chart patterns, candlestick patterns and harmonic patterns. In this guide, we focus on traditional chart patterns.
Additionally, traditional chart patterns are not used alone. It is certainly important to use other types of indicators and tools before making a market decision. This would increase our probabilities of being correct and entering or exiting the market at the right moment. Nonetheless, there is no 100% certainty with these types of analysis.
Traditional chart patterns have been used for several years (over 100 years) and are applied not only by humans but also by bots and robots that analyse the market. That means that our knowledge of traditional chart pattern has been evolving over time. Furthermore, these patterns have helped traders from all over the world to spot price fluctuations, breakouts and more.
Why are Chart Patterns Important?
Chart patterns are certainly important. They allow investors and technical analysts to understand how the market could continue moving. The price of assets follow different patterns and these price movements repeat over time.
By spotting chart patterns, investors are able to understand the path the price of an asset could follow. Moreover, using them with other indicators could give very high probabilities of success to the trader. Nevertheless, they are not 100% accurate and they should be used cautiously.
They have been very important as well to increase our knowledge of what price movements mean. We do not only know how the market works but we also understand that humans tend to behave with repeated patterns. Applying this to charts has been a very useful way to accurately predict some price movements in different markets and trading pairs.
Types of Traditional Chart Pattern
There are different traditional chart patterns in the market. Although there are many others, we will focus on the most popular ones. In this way, you will be able to recognize some of them.
These are the most popular types of traditional chart patterns:
- Head and Shoulders
- Double or Triple Top
- Double or Triple Bottom
- Triangles
- Channels
- Cup and Handle
When discovering any of these patterns, we would have valuable information about possible breakouts, trend continuations or support and resistance levels. It is worth taking into consideration that you can use these chart patterns with harmonic patterns and candlestick patterns.
In this way, you could have several confirmations of how the market could move and what the price tells us about a trading pair. In addition to it, adding support and resistance lines, using Fibonacci levels and fundamentals would increase the efficiency of our traditional chart patterns.
How to Draw Traditional Chart Patterns?
Drawing each of these patterns has its own technique. Indeed, there are different methods on how to draw the abovementioned chart patterns. However, you can use any of the platforms available right now in order to draw the most popular chart patterns.
For example, you can use TradingView, Metatrader 4 or even local cryptocurrency exchanges with chart integration and tools. When using traditional chart patterns, it is certainly necessary to combine their information with other types of indicators and data.
In this way, we would be able to have valuable information regarding the market and what we could expect from it in the future. As we mentioned before, there is no 100% success rate but it definitely helps us understand how the market works.


