

Harmonic patterns are chart patterns built around price swings and Fibonacci ratios. Traders use them to spot areas where a trend may pause, reverse, or complete. They are popular in forex, crypto, indices, and commodities because they give a structured way to map possible turning points rather than guessing from a chart by eye.
That said, harmonic patterns are not magic. They can fail, they can be drawn incorrectly, and they work best when combined with context such as trend, support and resistance, volume, and risk management.
If you are new to chart reading, think of harmonic patterns as a more precise version of pattern trading: instead of only recognising a shape, you also measure whether the legs of that shape line up with common Fibonacci retracement and extension levels.
Disclaimer: The information shared by AltSignals and its writers is for educational purposes only and should not be considered financial advice. Trading involves risk, and losses can exceed expectations. Never risk more than you can afford to lose, and consider speaking with a qualified financial adviser before making investment decisions.
What are harmonic patterns in trading?
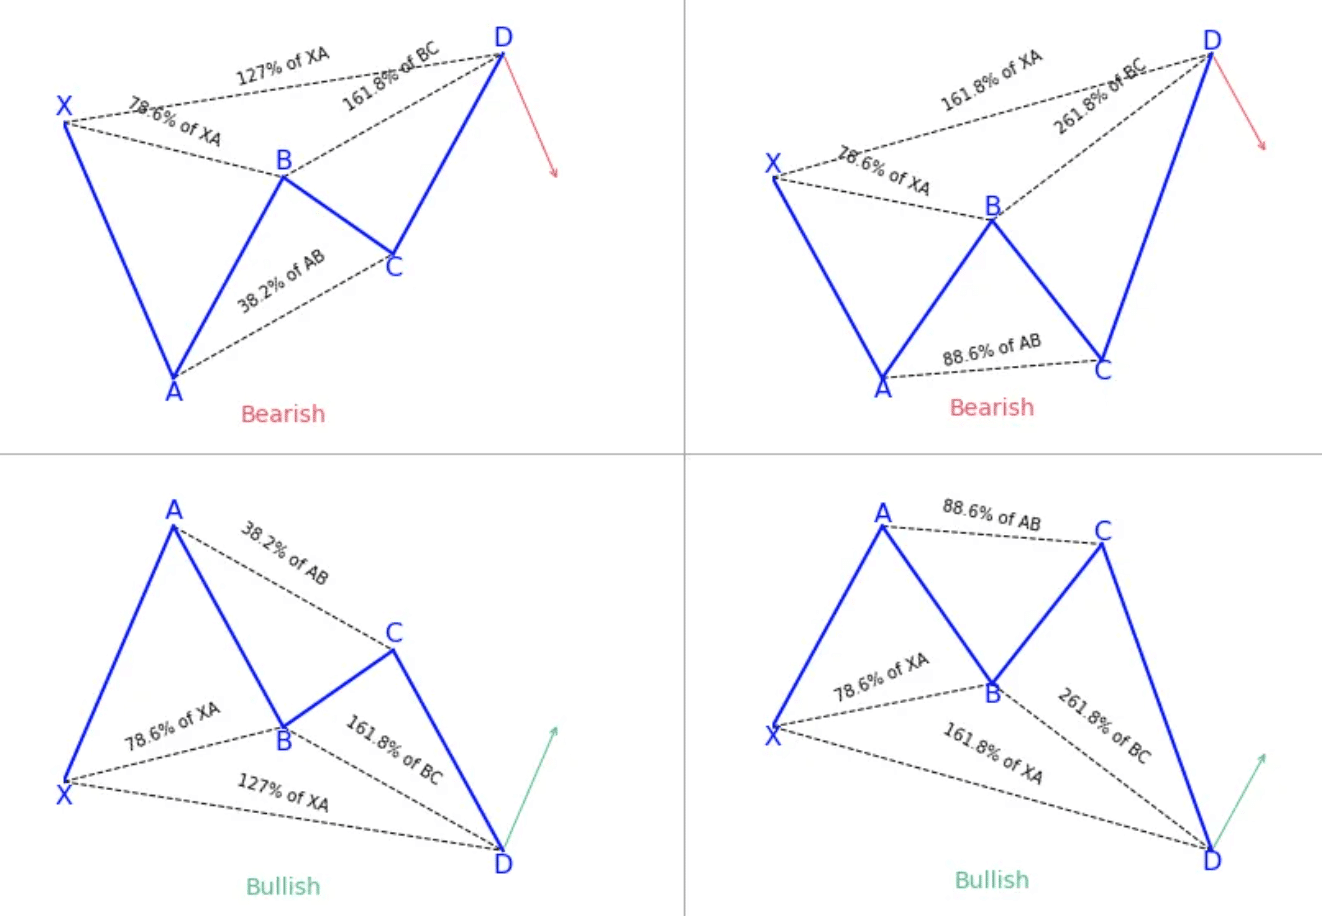
Harmonic patterns are geometric price formations that aim to identify potential reversal zones. Most are built from a sequence of price legs, often labelled X-A-B-C-D, where each move relates to the previous one through Fibonacci ratios.
The basic idea is simple: markets often move in waves, and some traders believe those waves tend to repeat in measurable ways. When the ratios between those swings line up, the final point of the pattern can mark an area where price may react.
Common harmonic patterns include:
- Bat
- Gartley
- Butterfly
- Crab
- Deep Crab
- Shark
- Cypher
Some patterns are bullish, meaning traders watch for a possible move higher after completion. Others are bearish, meaning traders watch for a possible move lower.
For a broader look at chart-based analysis, see our technical analysis guide.
Why traders use harmonic patterns
Harmonic patterns appeal to traders for one main reason: they create a rules-based framework. Instead of saying, “this looks like a reversal,” you are checking whether price has reached a specific area based on measured swings.
Traders typically use them to:
- identify possible reversal zones
- plan entries with more structure
- set invalidation levels more logically
- estimate profit targets using prior swing points
This does not make them automatically reliable. A neat-looking pattern on its own is still just a setup, not a guarantee. Confirmation matters.
How harmonic patterns work
Most harmonic trading setups rely on Fibonacci retracement and extension ratios. These ratios are widely used in technical analysis, especially 0.382, 0.500, 0.618, 0.786, 1.272, and 1.618.
In practice, traders measure one leg of a move and compare the next leg against it. If several legs align with the expected ratios for a known pattern, the final completion area becomes the zone of interest.
That completion area is often called the potential reversal zone, or PRZ. It is not a guaranteed turning point. It is simply the area where traders pay closer attention for confirmation.
If you want to understand the measurement side better, it helps to also review how to use MetaTrader 4 for charting and drawing tools.
Main types of harmonic patterns
There are several recognised harmonic patterns, but a few appear more often in trading education and charting platforms.
Gartley pattern
The Gartley is one of the best-known harmonic patterns. It is often treated as the classic starting point for learning harmonic trading because its structure is relatively easy to compare with other patterns.
Bat pattern
The Bat pattern is popular because traders often view it as a cleaner, more conservative reversal setup. It usually completes at a deeper retracement than some other structures.
Butterfly pattern
The Butterfly often extends beyond the starting point of the initial move. Because of that, it can appear near more dramatic exhaustion moves where price has stretched further before reversing.
Crab and Deep Crab
These patterns are known for deeper extensions and can form in fast-moving markets. They can offer sharp reversal setups, but they also require careful measurement because small drawing errors can change the interpretation.
Shark and Cypher
These are slightly less intuitive for beginners but still widely discussed. They are often used by traders who already have experience measuring retracements and extensions precisely.


Source: PatternsWizard
Harmonic patterns in forex
Harmonic patterns are especially common in forex trading because currency markets are liquid, heavily chart-driven, and widely analysed using technical tools. Traders often scan major pairs for repeating swing structures on timeframes ranging from 15-minute charts to daily charts.
Forex traders use harmonic patterns to look for:
- pullback entries in trending markets
- reversal setups near key support or resistance
- measured trade plans with defined risk
They are not limited to forex, though. The same logic is often applied to crypto, stocks, indices, and commodities. The pattern rules stay broadly similar, but market behaviour can differ. Crypto, for example, may produce more false breaks and sharper volatility around completion zones.
How to draw harmonic patterns
Drawing harmonic patterns manually takes patience. The shape has to look right, but the measurements also need to make sense. If the ratios are off, it is probably not the pattern you think it is.
A practical process looks like this:
- Identify a clear swing structure on the chart.
- Mark the major turning points.
- Use Fibonacci retracement and extension tools to measure each leg.
- Compare those measurements with the rules of the pattern you are testing.
- Mark the potential reversal zone around point D.
- Wait for confirmation instead of entering just because the shape looks tidy.
Many traders use charting software to speed this up. Platforms such as MT4, MT5, and TradingView offer drawing tools, and some traders use pattern-recognition indicators to scan charts automatically. That can save time, but it does not remove the need for judgement. Automated tools are good at finding shapes, but not always at filtering poor market context.
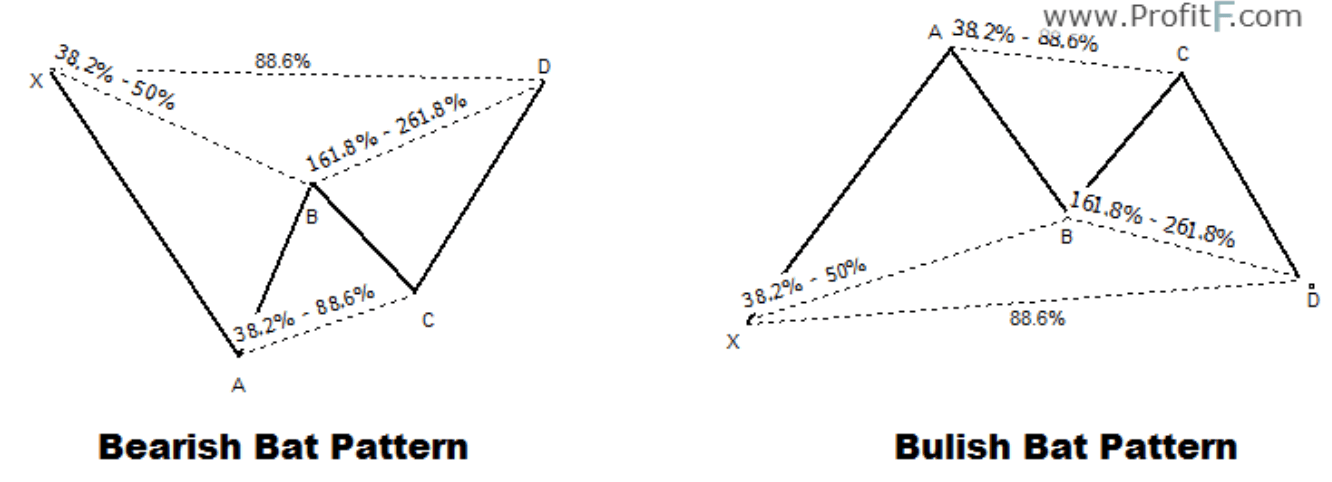
Source: Profitf.com
How to trade harmonic patterns
Trading a harmonic pattern usually starts with the completion zone, not the first leg of the pattern. By the time the setup is tradable, most of the structure has already formed.
A simple workflow is:
- Spot a valid pattern or near-valid structure.
- Mark the PRZ where the pattern completes.
- Look for confirmation, such as rejection candles, momentum slowing, or confluence with support and resistance.
- Define your stop-loss before entering.
- Set realistic targets based on prior swing levels or partial exits.
For example, in a bullish harmonic setup, a trader may wait for price to reach the PRZ and then look for signs that sellers are losing control. In a bearish setup, the trader may look for the opposite.
The key point is this: the pattern suggests where to pay attention. It does not remove the need for trade management.
Common mistakes traders make
- Forcing patterns: if you have to stretch the swing points to make it fit, it probably does not fit.
- Ignoring context: a pattern against a strong trend can fail quickly.
- Entering too early: many traders jump in before the pattern completes.
- Skipping confirmation: a PRZ is an area of interest, not a guaranteed reversal.
- Poor risk control: even a textbook setup can fail.
Are harmonic patterns reliable?
They can be useful, but they are not reliable enough to trade blindly. Their value comes from structure and discipline, not certainty. Traders who use them well usually combine them with broader technical analysis, clear invalidation levels, and sensible position sizing.
If you want a more systematic way to combine chart signals with technical tools, you can also explore the AltAlgo indicator.
For background on Fibonacci tools, the Investopedia guide to Fibonacci retracement is a useful primer.
Final thoughts
Harmonic patterns give traders a structured way to analyse price swings and possible reversal zones. That is their real strength. They help turn chart reading from “this looks interesting” into “this is the area I want to monitor, and this is where the setup fails.”
If you are learning them for the first time, start with one or two patterns, practise measuring them properly, and focus on risk management before anything else. The pattern itself is only part of the trade. The rest is execution.
FAQ
What is the easiest harmonic pattern for beginners to learn?
Do harmonic patterns work in crypto as well as forex?
They can be used in both markets, but crypto is often more volatile and can produce more false breaks around completion zones. That makes confirmation and risk management even more important.
Can you trade harmonic patterns without Fibonacci tools?
Not really. Fibonacci retracement and extension measurements are central to harmonic trading. Without them, you are mostly identifying general chart patterns rather than true harmonic setups.
Are harmonic patterns better on higher timeframes?
Many traders find higher timeframes cleaner because there is less noise, but harmonic patterns can appear on lower timeframes too. The trade-off is that lower timeframes may produce more false signals and require faster execution.


Many traders start with the Gartley or Bat pattern because they are widely taught and easier to compare with standard Fibonacci measurements. The main challenge is not memorising the name but learning to measure the legs correctly.