

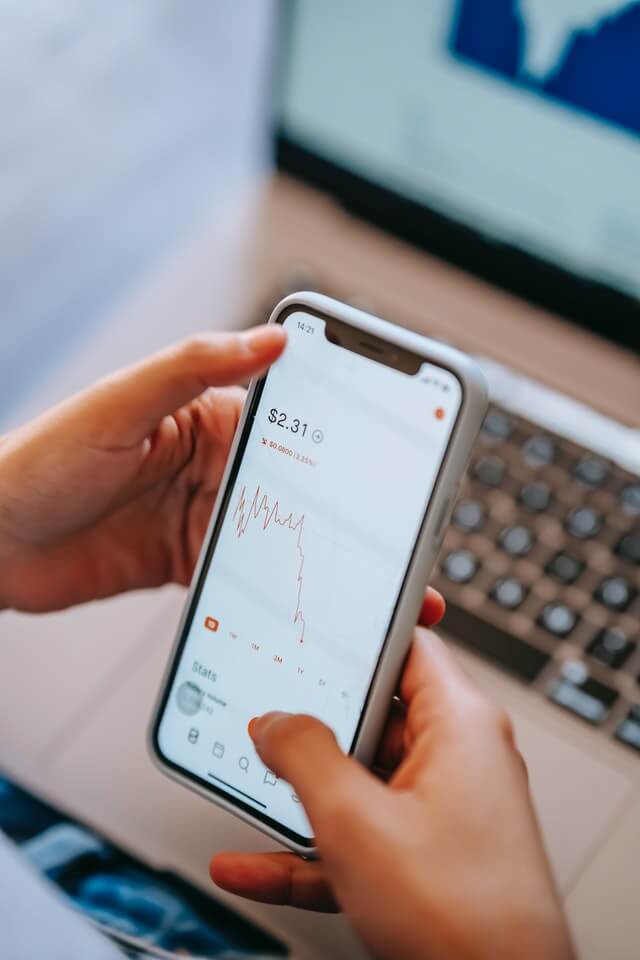
TradingView is a charting and market analysis platform used by traders across crypto, forex, stocks, indices, and commodities. If you are wondering what TradingView actually does, the short answer is this: it helps you read charts, plan trades, set alerts, and in some cases place orders through a connected broker or exchange.
That distinction matters. TradingView is not a broker itself. It is the workspace many traders use to analyse markets because the charts, indicators, and alert tools are usually better than what you get inside a basic exchange or broker app.
For beginners, it can feel like a lot at first. For experienced traders, it is often the default place to organise analysis. Either way, the platform is most useful when you treat it as a decision-support tool rather than a magic button that finds trades for you.
Disclaimer: the information shared by AltSignals and its writers should not be considered financial advice. This is for educational purposes only. We are not responsible for any investment decision you make after reading this post. Never invest more than what you are able to lose. Always contact your professional financial advisor.
What Is TradingView Used For?
TradingView is mainly used for charting, technical analysis, trade planning, and alerts. It gives traders one place to monitor markets and build a repeatable workflow.
In practical terms, people use TradingView to:
- view live and historical price charts
- switch between timeframes quickly
- apply indicators and drawing tools
- mark support, resistance, trend lines, and key zones
- build watchlists for different markets
- set price or indicator-based alerts
- test simple strategy ideas
- connect supported brokers or exchanges for execution
It also includes a social layer where users publish chart ideas and market commentary. That can be useful for learning how other traders think, but it is still best treated as research, not instruction. A clean chart and a clear plan usually beat copying someone else’s screenshot.
If your focus is technical analysis, TradingView fits naturally with broader chart-reading skills. For a wider look at that side of trading, see our guide to technical analysis.
How Does TradingView Work?

TradingView runs in the browser and on mobile apps, so you do not need heavy desktop software to get started. After creating an account, you can open a chart, choose a market, and customise the layout around your strategy.
The usual workflow looks like this:
- Search for the asset you want to analyse.
- Choose a timeframe that matches your trading style.
- Add indicators or drawing tools.
- Mark important levels and scenarios.
- Create alerts so you do not need to stare at the chart all day.
- If supported, connect a broker or exchange to place trades.
The free version is enough for many beginners. If you only need a few charts, a small watchlist, and basic alerts, it can do the job. Paid plans are more relevant for traders who want more alerts, more saved layouts, or a multi-chart workflow. Since plan limits can change, it is worth checking TradingView’s current pricing and feature pages directly before upgrading.
Can You Trade Directly on TradingView?
Yes, but only through supported broker and exchange integrations. TradingView itself does not hold your funds or act as the counterparty to your trade.
According to TradingView’s support documentation, users can trade directly from Supercharts by connecting supported providers through the trading panel. If your broker or exchange is not supported, you can still use TradingView for analysis and then place the trade manually on your execution platform.
That setup is common in crypto and forex. Many traders prefer TradingView for charting, then use their exchange or broker only for order entry and account management.
Before relying on direct execution, check:
- whether your provider is currently supported
- which order types are available through the integration
- whether the data feed matches the market you actually trade
- whether your alerts and execution workflow behave as expected
It is smart to test with small size first. A charting workflow that looks smooth in theory can still become messy if your execution setup is not properly configured.
Main TradingView Features
TradingView is popular because it combines several tools that traders would otherwise piece together across different platforms.
Charts Across Multiple Markets
You can analyse forex pairs, stocks, indices, commodities, and cryptocurrencies from one interface. That is useful if you trade more than one market or like to compare risk sentiment across assets.
For example, a crypto trader might watch Bitcoin alongside the US dollar index or major equity indices. A forex trader might compare a currency pair with gold or bond yields. TradingView makes that kind of cross-market context easier to manage.
Indicators and Drawing Tools
This is where TradingView earns its reputation. The platform includes a large library of built-in indicators and drawing tools, from moving averages and RSI to Fibonacci tools, channels, trend lines, and volume studies.
The key is not using everything at once. Most traders get better results from a simple setup they understand well than from stacking five indicators that all say roughly the same thing in different colours.
If you want ideas for building a cleaner chart setup, our guide to trading indicators for cryptocurrencies and stocks is a useful next read.
Alerts
Alerts are one of the most practical features on the platform. You can create notifications based on price levels, trend line breaks, or indicator conditions, which helps you avoid chasing moves after they have already happened.
For many traders, alerts are more valuable than extra indicators. They turn TradingView from a charting tool into a workflow tool.
Watchlists and Layouts
You can organise markets into watchlists and save chart layouts for different strategies. That matters more than it sounds. A tidy workspace makes it easier to review markets consistently instead of jumping between random charts and calling it analysis.
Custom Scripts and Community Tools
TradingView supports custom indicators and scripts through Pine Script. That gives traders access to community-built tools, signal overlays, and strategy templates.
Custom tools can be useful, but they still need common sense. A script that paints perfect-looking historical signals is not automatically useful in live conditions. Always check how a tool behaves in real time and whether it fits your actual strategy.


If you want to add a rules-based overlay to your charting workflow, you can explore the AltAlgo Indicator.
How to Use TradingView as a Beginner
If you are new to the platform, keep the first setup simple.
1. Start With One Market
Pick one asset or market you already follow. Learning the platform is easier when you are not also trying to learn ten new charts at the same time.
2. Choose One or Two Timeframes
A beginner does not need to check every timeframe from one minute to one month. Use the timeframe that matches your style, then one higher timeframe for context.
3. Add Only a Few Tools
A clean beginner setup might include support and resistance, one trend tool such as a moving average, and one momentum tool such as RSI. That is enough to learn how price behaves without turning the chart into modern art.
If you want a more practical look at RSI specifically, read our guide to the top RSI strategies.
4. Use Alerts Instead of Constant Screen Time
Set alerts around levels that matter to your plan. This helps you stay selective and reduces the temptation to force trades out of boredom.
5. Review Your Charts
Save screenshots, note why a setup interested you, and compare the outcome with your original idea. That habit is more useful than endlessly adding new indicators.
How to Trade Using TradingView
If you want to move from analysis to execution, the process is fairly straightforward.
Build a Clear Trade Plan
Before entering anything, define the setup: market, timeframe, entry trigger, stop-loss level, and target or exit condition. TradingView helps you visualise this, but it does not create discipline for you.
Mark the Important Levels
Use horizontal levels, trend lines, or zones to map where the trade idea works and where it fails. If you cannot explain the invalidation point clearly, the setup probably is not ready.
Set the Alert First
Rather than reacting emotionally to every candle, set the condition that would make the trade interesting. Let the market come to you.
Connect a Supported Provider
If your broker or exchange is supported, connect it through the trading panel and test the workflow carefully. If not, use TradingView for analysis and execute manually elsewhere.
Review the Outcome
After the trade, review whether you followed the plan. Good charting is useful, but consistent review is what turns charting into improvement.
Is TradingView Good for Beginners?
Yes. It is one of the more beginner-friendly charting platforms because the interface is relatively intuitive and the free version is usable. You can learn chart structure, indicators, and alerts without needing specialist desktop software.
The main beginner mistake is overcomplicating the setup. TradingView gives you a lot of flexibility, which is helpful right up until you decide that twelve indicators and six colours count as a strategy.
Start simple, build a routine, and only add tools when you know why they belong on the chart.
TradingView Pros and Limitations
What It Does Well
- clean charting across multiple asset classes
- strong indicator and drawing-tool library
- alerts that fit real trading workflows
- browser-based access with mobile support
- community scripts and shared chart ideas
Where It Has Limits
- direct trading depends on supported integrations
- some useful features sit behind paid plans
- community indicators vary in quality
- good charts do not remove execution risk or trading risk
That last point matters most. TradingView can improve how you analyse markets, but it does not improve a weak strategy by itself.
Final Thoughts
TradingView is best thought of as a trading workspace. It helps you analyse charts, organise watchlists, set alerts, test ideas, and sometimes place trades through supported providers.
Its real value is not that it predicts the market. It is that it makes your analysis more structured and easier to repeat. For most traders, that is far more useful.
If you want to combine charting with a more structured signal workflow, you can explore the AltSignals membership.
FAQ
Is TradingView free to use?
Is TradingView a broker?
No. TradingView is a charting and analysis platform, not a broker or exchange. You can only place trades through it when you connect a supported broker or exchange account.
Can beginners learn technical analysis on TradingView?
Yes. TradingView is a practical place to learn chart structure, support and resistance, indicators, and alerts. The best approach is to start with a simple chart setup rather than trying to use every tool at once.
Does TradingView work for crypto and forex?
Yes. TradingView is widely used for both crypto and forex, as well as stocks, indices, and commodities. The exact data and execution options depend on the market and provider you use.


Yes, TradingView has a free plan that is enough for many beginners. Paid plans are mainly useful if you need more alerts, more layouts, or a heavier multi-chart workflow.