

Most beginners start the same way: they open a chart, add five indicators, and somehow end up understanding less than before.
The fix is not using more tools. It is using a few reliable trading indicators well.
If you trade cryptocurrencies or stocks, these five indicators are a practical starting point: Bollinger Bands, MACD, Fibonacci retracement levels, RSI, and moving averages. Each helps you read a different part of the market, from trend and momentum to volatility and possible support or resistance.
This article keeps it simple and focused on how these indicators work, what they are good for, and where traders often misuse them.
Disclaimer: This content is for educational purposes only and should not be considered investment advice. Markets can move quickly, and no indicator guarantees profitable trades. Never risk more than you can afford to lose, and consider speaking with a qualified financial adviser before making investment decisions.
What trading indicators actually do
Trading indicators do not predict the future. They organise price data so you can spot patterns more clearly.
Some indicators help identify trend. Others measure momentum, volatility, or likely support and resistance zones. The useful part is not the indicator itself. It is how you combine it with price action, volume, and risk management.
If you are still building your foundation, it helps to start with a broader crypto trading guide before layering on more advanced setups.
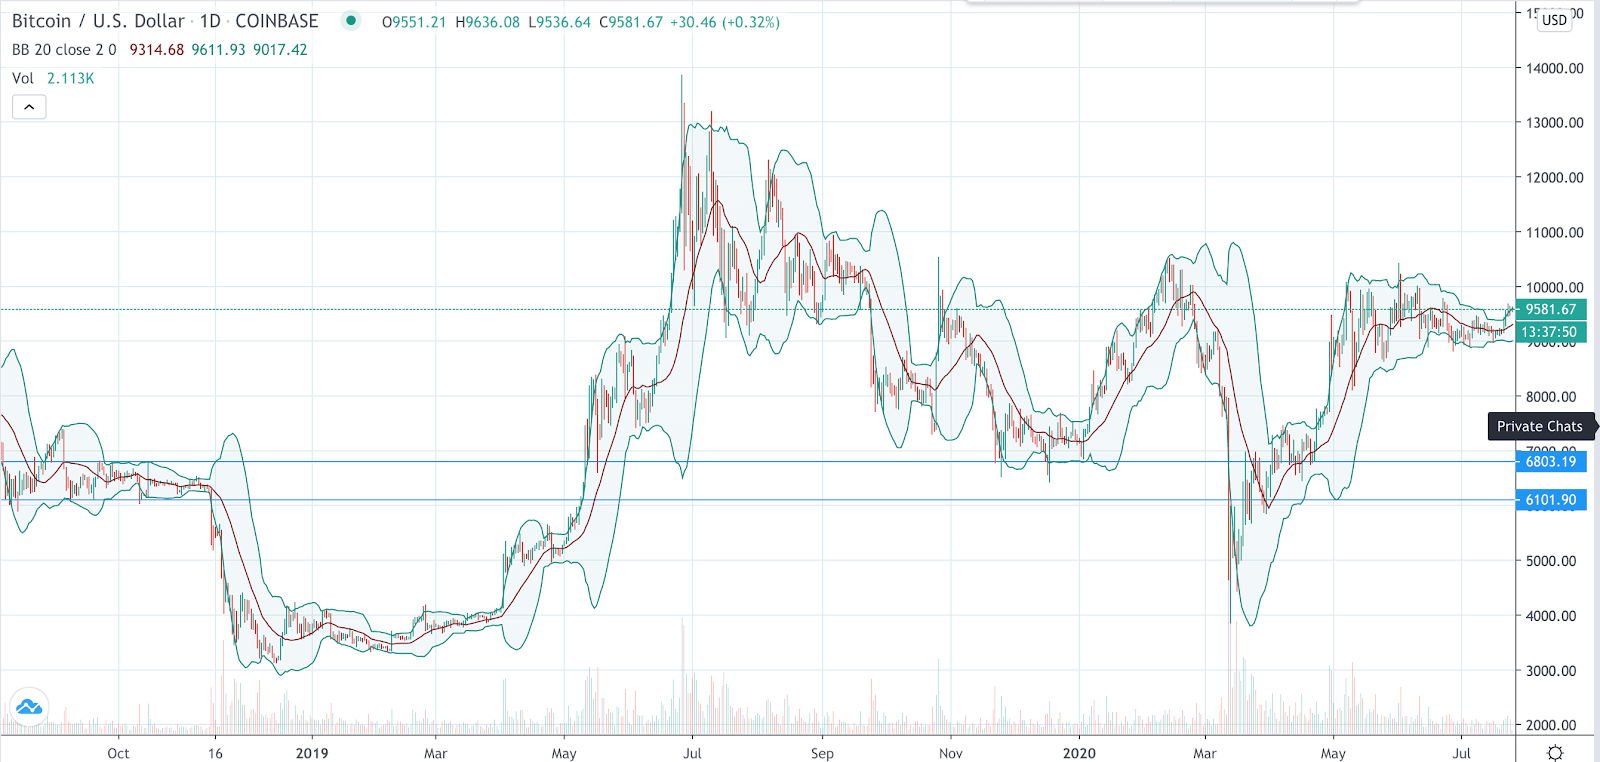
1. Bollinger Bands
Bollinger Bands are a volatility indicator built around a moving average with an upper and lower band. When volatility expands, the bands widen. When the market quiets down, they contract.
Traders often use Bollinger Bands to judge whether price is stretching too far from its recent average or whether volatility is starting to build.
How traders read them:
- Price pushing along the upper band can suggest strong bullish momentum
- Price hugging the lower band can suggest strong bearish momentum
- A band squeeze can hint that a larger move may be coming
- A move back toward the middle band can suggest momentum is cooling
Common mistake: treating every touch of the upper band as a sell signal or every touch of the lower band as a buy signal. In strong trends, price can stay near an outer band longer than beginners expect.
2. MACD
MACD stands for Moving Average Convergence Divergence. It is a momentum-following indicator that helps traders judge whether momentum is strengthening, weakening, or shifting direction.
It usually includes two lines and a histogram. Traders watch for crossovers, the distance between the lines, and whether momentum is building or fading.
What MACD is useful for:
- Spotting possible trend shifts
- Confirming momentum behind a move
- Comparing price action with momentum direction
One important correction: MACD does not directly show support and resistance levels. It is better used as a momentum and trend-confirmation tool, not as a map of horizontal price levels.
Many traders pair MACD with moving averages or clear chart structure rather than using it on its own.

3. Fibonacci retracement levels
Fibonacci retracement is technically a charting tool rather than a pure indicator, but it is still one of the most widely used tools in technical analysis.
Traders draw Fibonacci levels between a meaningful swing low and swing high, or the other way around in a downtrend, to identify areas where price may pause, retrace, or react.
Why traders use it:
- To estimate pullback zones during a trend
- To identify possible support and resistance areas
- To combine with trendlines, moving averages, or candlestick signals
Fibonacci works best when there is already a clear trend or swing structure on the chart. If you draw it on random price noise, it will happily give you random-looking levels back.

This tool can be used across multiple time frames, but higher time frames usually carry more weight than very short-term charts.
4. Relative Strength Index (RSI)
RSI is a momentum oscillator that moves between 0 and 100. It is commonly used to identify overbought and oversold conditions, but that is only part of the story.


The classic interpretation is simple:
- Above 70 may suggest overbought conditions
- Below 30 may suggest oversold conditions
- Between 30 and 70 is the middle range, not a signal that price is automatically stable
That last point matters. RSI sitting in the middle usually means momentum is less extreme, not that the market has become neutral or safe.
More experienced traders also watch for divergence. For example, if price makes a new high but RSI does not, momentum may be weakening. That does not guarantee a reversal, but it can be a useful warning sign.

5. Moving averages
Moving averages are among the most useful indicators for both stocks and crypto because they simplify trend direction.
A moving average shows the average price over a selected period. Common examples include the 20-day, 50-day, and 200-day moving averages, though intraday traders may use shorter settings.
Why traders like them:
- They smooth out noisy price action
- They help identify trend direction
- They can act as dynamic support or resistance
- Crossovers can be used as confirmation signals
There are also different types, mainly simple moving averages (SMA) and exponential moving averages (EMA). EMAs react faster to recent price changes, while SMAs are slower and smoother.
If price is consistently trading above a key moving average, traders often read that as a sign of strength. If price stays below it, sentiment may be weaker. Still, moving averages lag because they are based on past data. Useful, yes. Magical, no.

Which indicator is best for beginners?
If you are just starting out, moving averages and RSI are usually the easiest pair to learn.
Moving averages help you understand trend. RSI helps you judge momentum. Once that makes sense, MACD and Bollinger Bands become easier to interpret, and Fibonacci becomes more useful when you can already identify clean swings on a chart.
A simple beginner workflow could look like this:
- Use moving averages to define the trend
- Use RSI or MACD to check momentum
- Use Bollinger Bands or Fibonacci to refine entries and exits
- Always set risk before placing the trade
Why one indicator is never enough
No indicator works all the time, in every market, on every time frame. Crypto can be more volatile than stocks, and both can behave very differently during trending versus range-bound conditions.
That is why traders usually look for confluence. For example, a pullback into a moving average, near a Fibonacci level, while RSI cools from an extreme reading is more useful than a single isolated signal.
If you want help turning chart analysis into clearer trade ideas, you can explore the AltAlgo indicator or review AltSignals trading signals as a practical next step.
Final thoughts
The best trading indicators for cryptocurrencies and stocks are not necessarily the fanciest ones. They are the ones you understand well enough to use consistently.
Bollinger Bands, MACD, Fibonacci retracement levels, RSI, and moving averages remain popular because they cover the basics that matter: volatility, momentum, trend, and structure.
Start with one or two. Test them on a demo account or small position sizes. Keep notes. If an indicator only makes sense after you have added six more indicators to explain it, that is usually your chart asking for mercy.
FAQ
What is the most accurate trading indicator?
Are trading indicators different for crypto and stocks?
The indicators themselves are mostly the same, but the way they behave can differ because crypto is often more volatile and trades around the clock. That means traders may need to adjust settings, time frames, and risk controls when moving between crypto and stocks.
Should beginners use multiple indicators at once?
Yes, but keep it limited. Two or three complementary indicators are usually enough. For example, one trend indicator and one momentum indicator can be more useful than stacking five tools that all tell you roughly the same thing.
Can indicators guarantee profitable trades?
No. Indicators are decision-support tools, not guarantees. They can help you read the market more clearly, but losses are still part of trading. Position sizing, stop-loss placement, and discipline matter just as much as the setup itself.


There is no single most accurate trading indicator. Accuracy depends on market conditions, time frame, and how the indicator is used with price action and risk management. Moving averages, RSI, and MACD are popular because they are simple and versatile, not because they are flawless.