

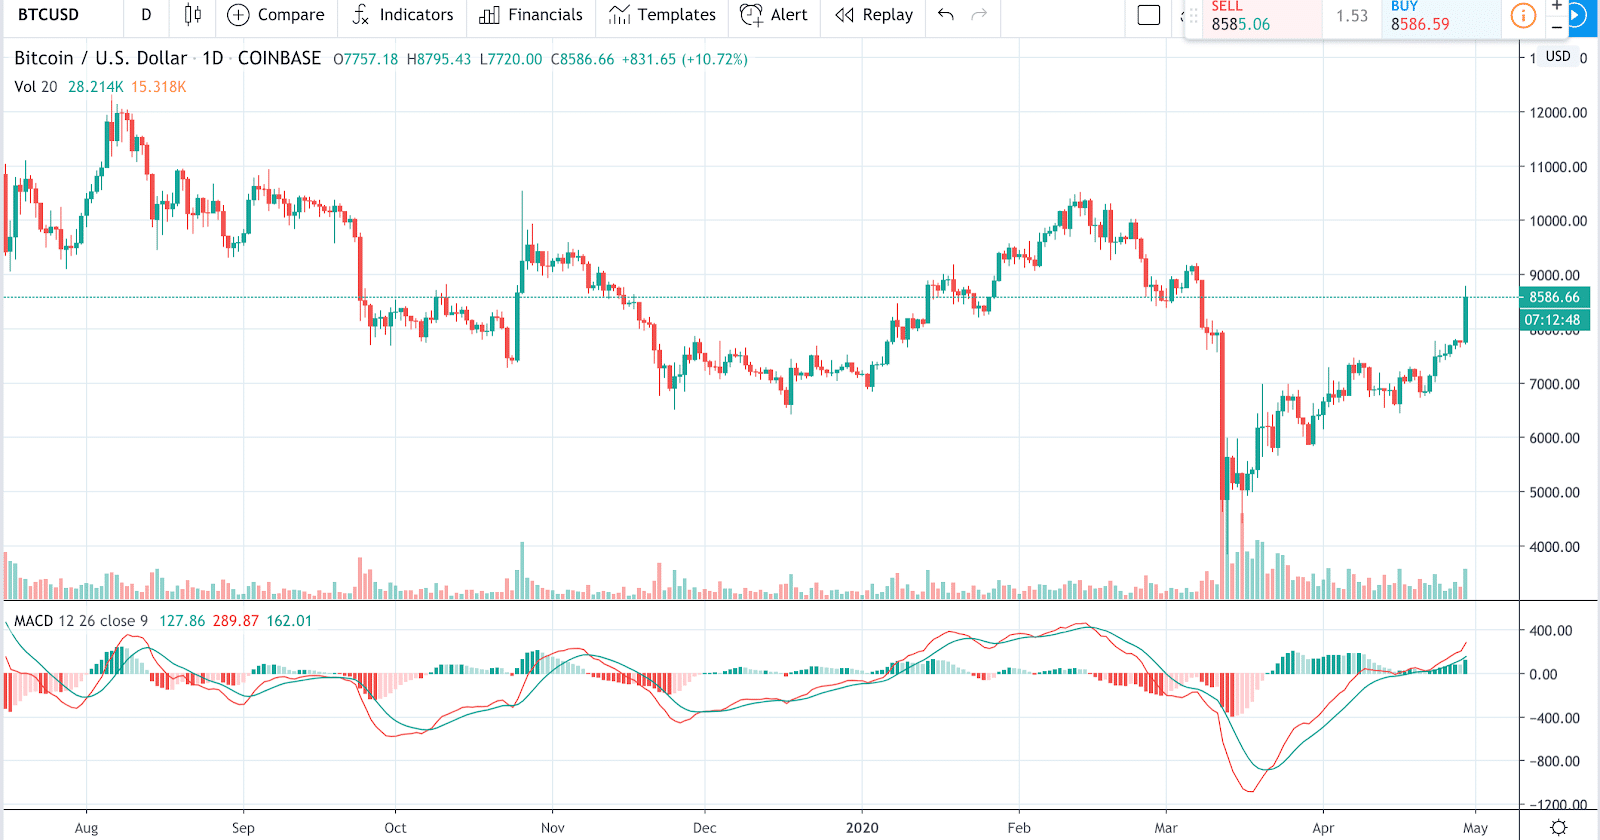
MACD is one of those indicators almost every trader ends up using at some point. Not because it is magic, but because it does a good job of showing momentum, trend direction, and possible shifts in market sentiment in a simple format.
If you trade crypto, MACD can help you spot when momentum is strengthening, fading, or starting to turn. The catch is that it works best as a confirmation tool, not as a standalone buy-or-sell button.
This guide breaks down how the MACD indicator works in cryptocurrency markets, how to read its signals, and where traders often get it wrong.
Disclaimer: This article is for educational purposes only and should not be considered financial advice. Crypto markets are volatile, and no indicator is accurate all the time. Never risk more than you can afford to lose, and consider speaking with a qualified financial adviser before making trading decisions.
What is the MACD indicator?
MACD stands for Moving Average Convergence Divergence. It is a momentum-following indicator built from moving averages, and traders use it to assess trend strength, momentum shifts, and possible entry or exit zones.
The standard MACD setup uses three values:
- 12-period EMA
- 26-period EMA
- 9-period signal line
On most charting platforms, MACD is made up of three parts:
- MACD line: the difference between the 12 EMA and 26 EMA
- Signal line: a 9-period EMA of the MACD line
- Histogram: the distance between the MACD line and the signal line
That may sound technical, but the practical takeaway is simple: MACD helps you see whether bullish or bearish momentum is gaining or losing strength.
Why MACD is useful in crypto trading
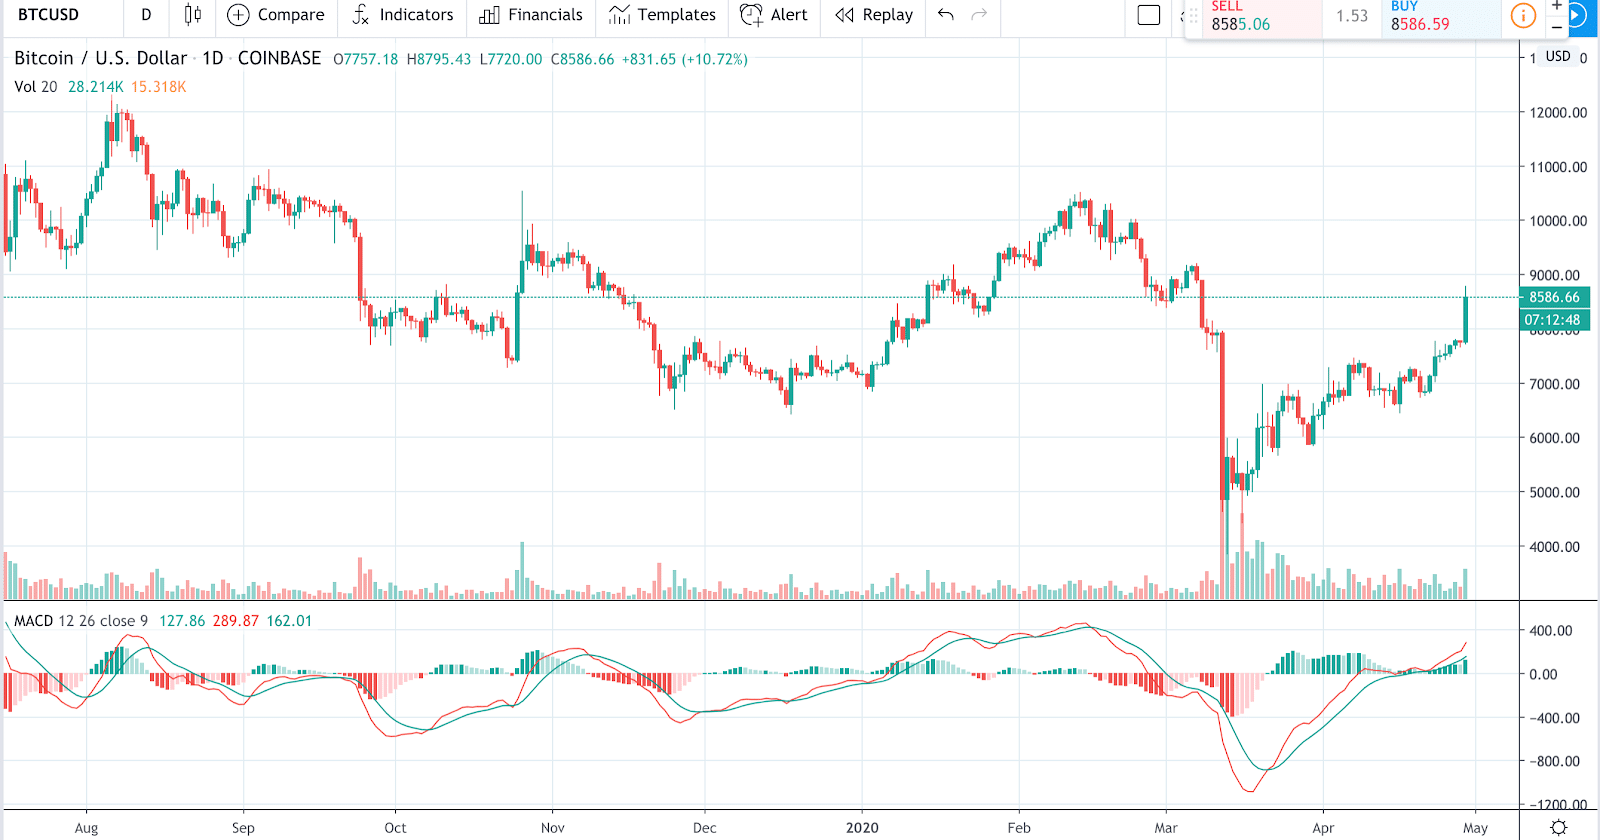
Crypto markets move fast, trade around the clock, and can flip from trend to chop without much warning. That makes momentum analysis especially useful.
MACD can help traders:
- confirm whether a trend has strength behind it
- spot possible momentum reversals
- identify bullish or bearish crossovers
- avoid chasing moves that are already losing steam
It is still a lagging indicator, which means it reacts to price rather than predicting it. That is why many traders combine it with price action, support and resistance, volume, or another indicator instead of using it alone.
If you want a broader foundation first, it helps to read our crypto trading guide.
How to read the MACD indicator
There are three core things to watch when using MACD on crypto charts.
1. MACD line and signal line crossovers
This is the signal most beginners notice first.
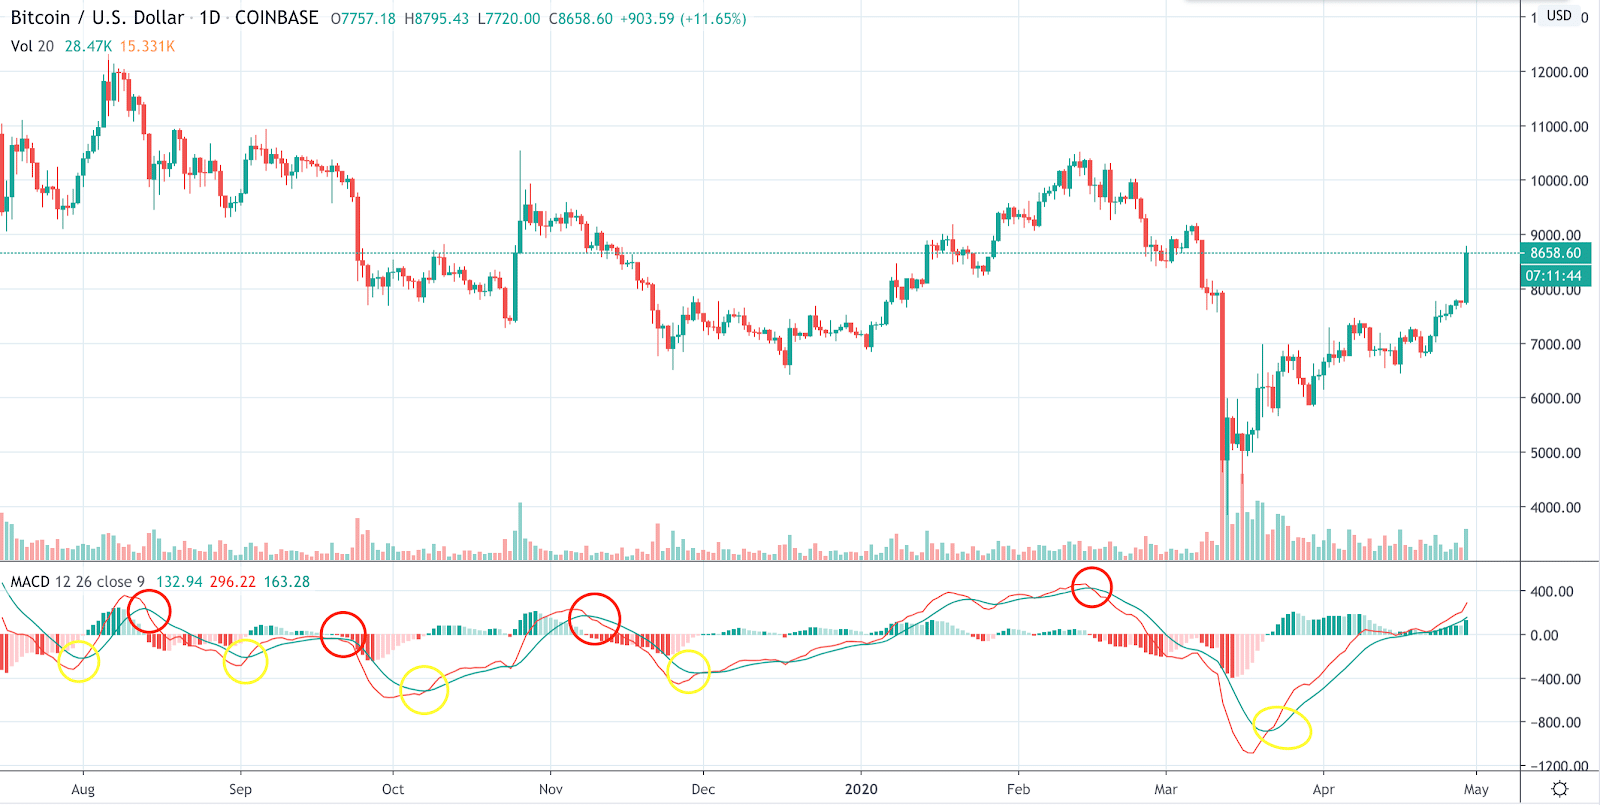
- When the MACD line crosses above the signal line, traders often treat it as a bullish signal.
- When the MACD line crosses below the signal line, traders often treat it as a bearish signal.
These crossovers can be useful, but context matters. A bullish crossover in a strong downtrend is not the same as a bullish crossover after a clean breakout and rising volume.
2. The zero line
The zero line gives you a quick read on broader momentum.
- When MACD is above zero, shorter-term momentum is stronger than longer-term momentum, which usually supports a bullish view.
- When MACD is below zero, momentum is weaker, which usually supports a bearish view.
Many traders use the zero line as a filter. For example, they may prefer long setups only when MACD is above zero, or short setups only when it is below zero.
3. The histogram
The histogram shows the gap between the MACD line and the signal line. This is useful because it can reveal momentum changes before a crossover becomes obvious.
- Growing bars suggest momentum is strengthening.
- Shrinking bars suggest momentum is fading.
That does not automatically mean price will reverse, but it can warn you that the current move is losing force.
How to use MACD for crypto entries and exits
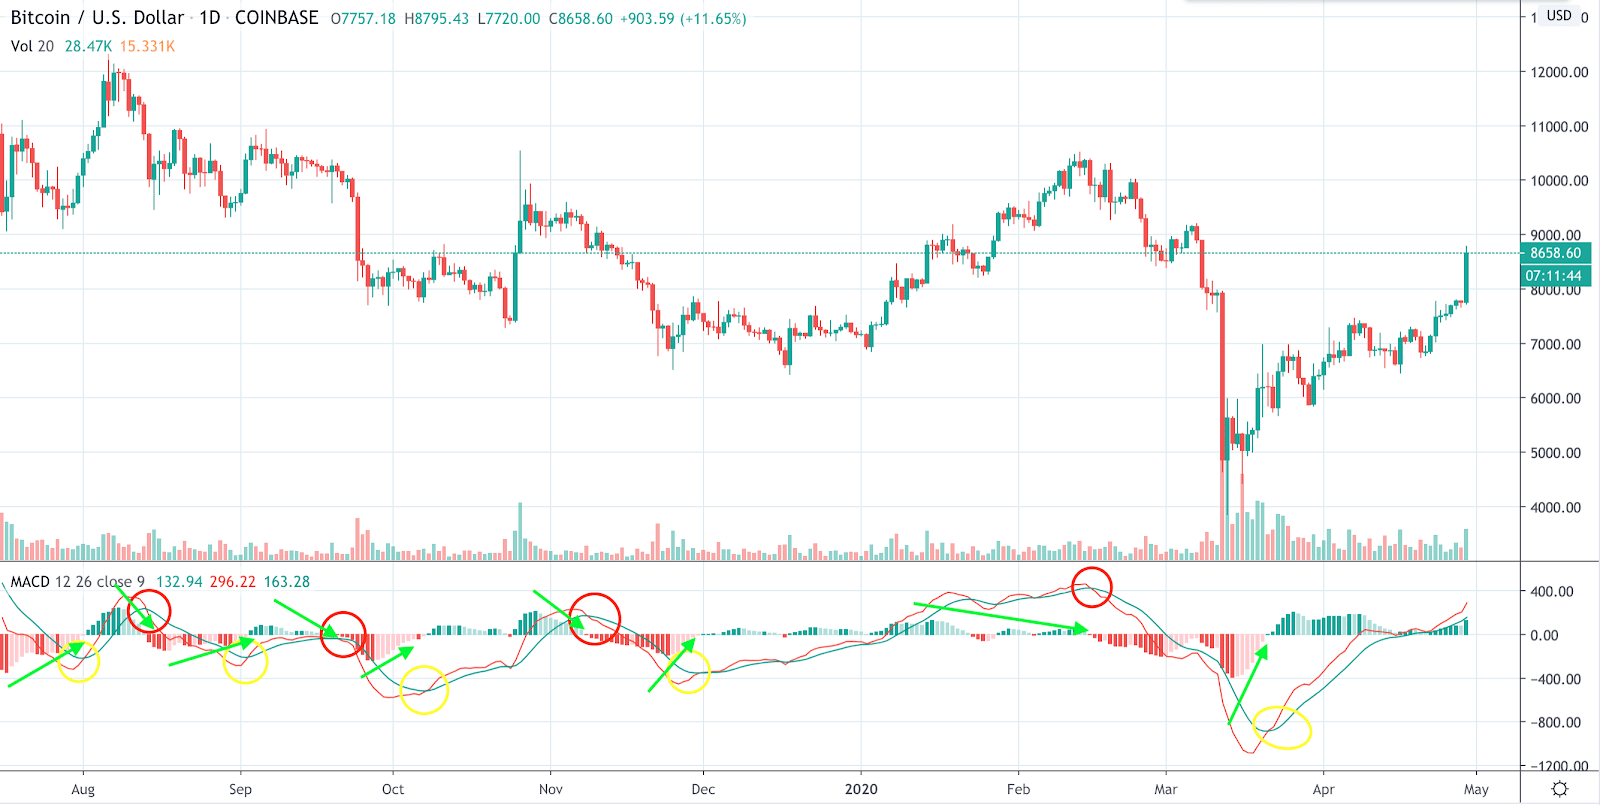
A practical way to use MACD is to treat it as a confirmation layer.
For example, a trader might look for:


- price holding above support or breaking resistance
- a bullish MACD crossover
- histogram bars expanding in the same direction
- volume supporting the move
That kind of alignment is usually more useful than taking every crossover in isolation.
For exits, traders often watch for:
- a bearish crossover after a strong run
- histogram bars shrinking while price struggles to continue higher
- MACD divergence against price
None of these signals guarantees a reversal, but they can help you manage risk earlier instead of reacting late.
MACD divergence in crypto
Divergence happens when price and MACD stop moving in sync.
- Bullish divergence: price makes a lower low, but MACD makes a higher low. This can suggest bearish momentum is weakening.
- Bearish divergence: price makes a higher high, but MACD makes a lower high. This can suggest bullish momentum is fading.
Divergence can be useful in crypto, especially near major support or resistance, but it is not an instant reversal signal. Markets can stay overextended longer than traders expect.
Common MACD mistakes traders make
- Using MACD alone: It works better with price structure, volume, and key levels.
- Trading every crossover: Sideways markets can produce a lot of false signals.
- Ignoring timeframe context: A bullish signal on a 5-minute chart may mean very little against a bearish higher timeframe trend.
- Forgetting it lags: MACD confirms momentum shifts; it does not predict every turning point.
- Over-optimising settings: The default 12, 26, 9 setup is popular for a reason. Tweaking settings too much can create more noise than edge.
Best way to combine MACD with other tools
MACD tends to be more reliable when paired with simple chart analysis.
Useful combinations include:
- Support and resistance: MACD signals near key levels are often more meaningful.
- Trendlines or market structure: Helps you avoid taking bullish signals in clearly bearish conditions.
- RSI: Can help confirm whether momentum is stretched or recovering.
- Volume: Stronger volume can support the validity of a breakout or reversal attempt.
If you want a more structured toolset, the AltAlgo indicator can help you read setups more clearly without relying on a single signal.
You can also compare MACD with other commonly used tools in our guide to the top trading indicators traders should pay attention to.
Should you use MACD for crypto trading?
Yes, but with realistic expectations.
MACD is useful for reading momentum and confirming trend direction. It is beginner-friendly, widely available, and still relevant because it helps simplify what price is already doing.
What it does not do is remove risk or produce perfect signals. In fast crypto markets, false positives happen, especially in low-volume or range-bound conditions.
That is why many traders use MACD as one part of a broader process rather than the whole process.
If you want trade ideas backed by a wider analysis framework, you can explore AltSignals trading signals as a practical next step.
Final thoughts
MACD remains one of the most useful indicators for crypto traders because it is simple, flexible, and good at highlighting momentum shifts. The strongest way to use it is not to chase every crossover, but to combine it with trend, structure, and risk management.
Used that way, MACD can help you make cleaner decisions and avoid some of the noise that makes crypto trading harder than it needs to be.
FAQ
Is MACD a good indicator for crypto?
What is the best MACD setting for crypto?
The default MACD settings of 12, 26, and 9 are the most widely used and are a sensible starting point for most crypto traders. Some traders adjust settings for faster or slower markets, but changing them too much can reduce reliability.
What does the MACD histogram tell you?
The histogram shows the distance between the MACD line and the signal line. Expanding bars suggest momentum is strengthening, while shrinking bars suggest momentum is fading.
Can MACD predict crypto reversals?
Not exactly. MACD is a lagging indicator, so it confirms changes in momentum rather than predicting reversals with certainty. Divergence and histogram shifts can provide early warnings, but they still need confirmation.





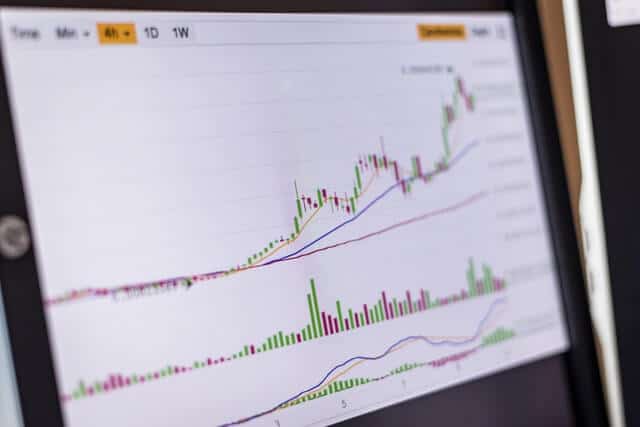









MACD can be a good indicator for crypto because it helps traders read momentum and trend direction. It is most effective when used alongside price action, support and resistance, and volume rather than as a standalone signal.