

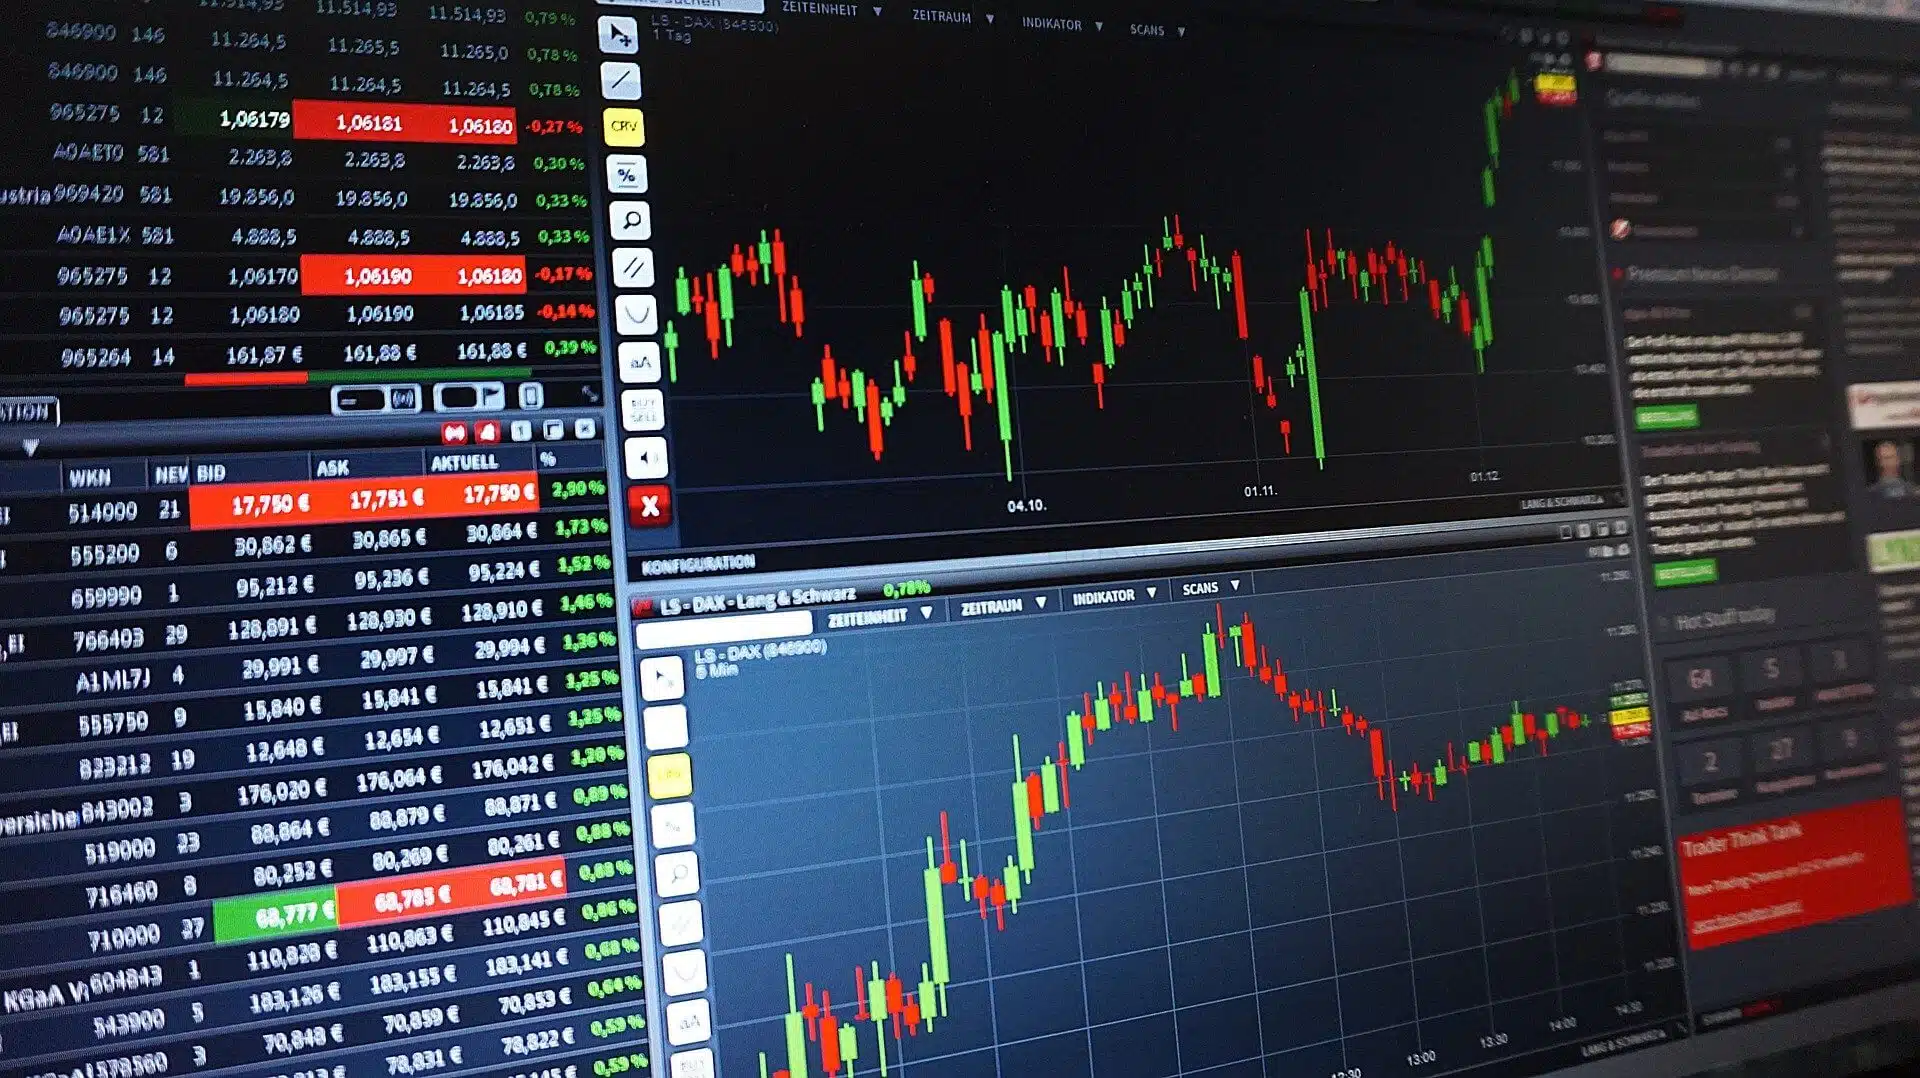
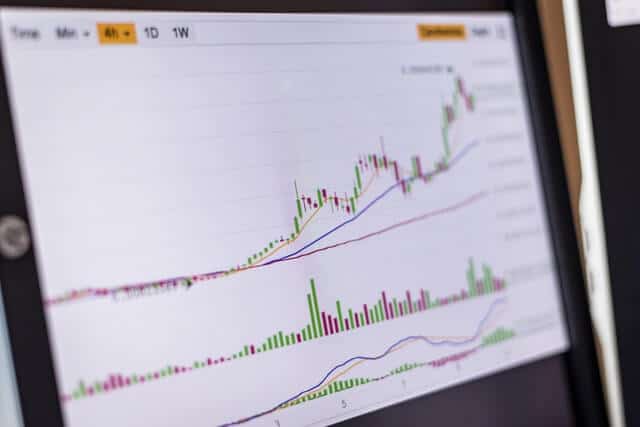
The Ichimoku Cloud looks busy at first glance, but the idea behind it is simple: it helps you read trend, momentum, and potential support or resistance in one view.
That is why traders keep coming back to it. Instead of stacking several separate indicators on a chart, Ichimoku tries to give you a broader market picture at a glance. Used well, it can help you answer a few practical questions quickly: Is the trend up or down? Is momentum strengthening or fading? Where might price stall or bounce?
This guide explains how the Ichimoku Cloud works, how to read its main signals, and how traders often use it alongside other tools rather than in isolation.
Disclaimer: This article is for educational purposes only and should not be considered investment advice. Markets are risky, and no indicator is accurate all the time. Never risk more than you can afford to lose, and consider speaking with a qualified financial adviser before making trading decisions.
If you want a broader foundation first, start with our technical analysis guide. If you want to compare Ichimoku with another popular momentum tool, you can also read our guide to RSI strategies.
What is the Ichimoku Cloud?
The Ichimoku Cloud, or Ichimoku Kinko Hyo, is a technical analysis indicator developed by Japanese analyst Goichi Hosoda. It is designed to show trend direction, momentum, and support and resistance on a single chart.
The “cloud” itself is the shaded area between two projected lines. When price is above the cloud, traders usually read that as a bullish environment. When price is below the cloud, it is usually read as bearish. When price is inside the cloud, the market is often considered neutral or indecisive.
That broad read is one reason the indicator remains popular across crypto, forex, and stocks. It is not magic, but it is useful because it combines several pieces of information in one place.

The five parts of the Ichimoku indicator

To use Ichimoku properly, it helps to know what each line is doing. You do not need to memorise every formula to read the chart well, but you should understand the role of each component.
1. Tenkan-sen (Conversion Line)
This is a shorter-term line that reacts faster to price movement. Traders often use it to gauge short-term momentum.
When the Tenkan-sen turns up sharply, it can suggest improving momentum. When it rolls over, momentum may be weakening.
2. Kijun-sen (Base Line)
This is a slower line and is often treated as a reference point for the current trend. Many traders watch how price behaves around the Kijun-sen during pullbacks.
In an uptrend, price holding above the Kijun-sen can suggest the trend is still intact. In a downtrend, repeated rejection below it can reinforce bearish conditions.
3. Senkou Span A
This is one of the two lines that forms the cloud. It is projected forward, which is part of what makes Ichimoku different from many standard indicators.
4. Senkou Span B
This is the second cloud boundary, also projected forward. Together with Senkou Span A, it creates the shaded cloud area traders use to judge future support and resistance zones.
5. Chikou Span (Lagging Line)
This line plots the current closing price back in time. It is often used as a confirmation tool. If the Chikou Span is above past price action, that can support a bullish read. If it is below past price action, that can support a bearish one.
How to read the Ichimoku Cloud
If you are new to the indicator, start with the basics before worrying about advanced setups.
Price above the cloud
This usually signals a bullish trend. The cloud can also act as a support zone if price pulls back.
Price below the cloud
This usually signals a bearish trend. In that case, the cloud may act as resistance on rallies.
Price inside the cloud
This often means the market is in transition or moving sideways. Many traders become more cautious here because signals tend to be less clean.
Cloud colour and shape
When Senkou Span A is above Senkou Span B, the cloud is typically bullish. When Senkou Span A is below Senkou Span B, the cloud is typically bearish.
The thickness of the cloud matters too. A thicker cloud can suggest a stronger support or resistance zone. A thinner cloud may be easier for price to break through.
Common Ichimoku signals traders watch
Tenkan-sen and Kijun-sen crossover
One of the most common Ichimoku signals is the crossover between the Conversion Line and the Base Line: a bullish crossover happens when the Tenkan-sen crosses above the Kijun-sen, while a bearish crossover happens when it crosses below.
Context matters. A bullish crossover above the cloud is generally considered stronger than one that happens inside the cloud. The same logic applies in reverse for bearish signals below the cloud.
Cloud breakout
When price breaks above the cloud after trading below or inside it, traders may treat that as a bullish shift. A break below the cloud can suggest bearish continuation or reversal.


Breakouts are more convincing when they are supported by volume, broader market structure, or confirmation from other indicators.
Kijun-sen bounce
In trending markets, price often pulls back toward the Base Line before continuing. Some traders use this as a trend-following setup rather than chasing extended moves.
That said, a bounce is not guaranteed. If price slices through the Kijun-sen and loses the cloud as support, the trend may be weakening.
Chikou Span confirmation
Some traders use the lagging line as a filter. If the rest of the chart looks bullish but the Chikou Span is still tangled in prior price action, they may wait for a cleaner setup.
Support and resistance levels
The cloud is often treated as a dynamic support or resistance zone rather than a single price level.
When price approaches the cloud from above, traders may look for support. When price approaches it from below, they may expect resistance. This is especially useful in markets that trend cleanly, because the cloud can help frame pullbacks without relying only on horizontal levels.
Still, the cloud should not be treated as an unbreakable wall. Strong news, volatility spikes, or broader market weakness can push price straight through it. That is why risk management matters more than indicator loyalty.
How traders use Ichimoku in practice
A practical way to use Ichimoku is to treat it as a market filter first and a signal tool second.
For example, if price is above the cloud, you might focus more on long setups than short ones. If price is below the cloud, you might focus more on short setups or stay defensive. If price is inside the cloud, you might wait for clearer direction.
From there, traders often combine Ichimoku with candlestick structure, horizontal support and resistance, or momentum tools like RSI. If you want to build a more systematic workflow around indicators, the AltAlgo indicator is worth exploring as a practical next step.
Best markets and timeframes for Ichimoku
Ichimoku can be used on crypto, forex, stocks, and indices. It tends to be most useful in markets that are actually trending. In choppy conditions, the chart can produce more noise and weaker signals.
It can also be applied across multiple timeframes. Higher timeframes often produce cleaner signals, while lower timeframes can be more reactive but also more erratic. Many traders use a higher timeframe to define trend direction and a lower timeframe to refine entries.
If your focus is crypto specifically, it also helps to understand how indicator behaviour changes in more volatile markets. For that, see our guide to technical analysis in crypto.
Limitations of the Ichimoku Cloud
Ichimoku is useful, but it has a few obvious limitations.
- It can look overwhelming to beginners.
- It works better in trending markets than in sideways ones.
- Signals can arrive late after a large move has already started.
- Like any indicator, it can produce false signals.
That last point matters most. No indicator should be used on its own. A clean-looking cloud setup can still fail if the broader market context is weak, liquidity is thin, or risk is poorly managed.
For a more detailed breakdown of how technical indicators fit into a wider trading process, the Fidelity overview of Ichimoku Cloud and the StockCharts ChartSchool explanation are useful references.
Final thoughts
The Ichimoku Cloud is popular for a reason. It gives you a quick read on trend, momentum, and potential support or resistance without forcing you to juggle a dozen separate tools.
The catch is that it works best when you keep it practical. Start with the basics: where price is relative to the cloud, whether the cloud is bullish or bearish, and how the Tenkan-sen and Kijun-sen are behaving. Once that becomes second nature, you can layer in more nuance.
Used with patience and proper risk control, Ichimoku can be a solid part of a trading process. Used blindly, it is just a colourful chart.
FAQ
Is the Ichimoku Cloud good for beginners?
Does Ichimoku work for crypto trading?
It can. Many crypto traders use Ichimoku because it helps frame trend and momentum clearly. Just remember that crypto can be more volatile than other markets, which means false breakouts and fast reversals are common.
What is the strongest Ichimoku signal?
Many traders consider a bullish crossover above the cloud, with the Chikou Span confirming, to be one of the stronger bullish setups. On the bearish side, the reverse applies below the cloud. Even then, no signal is guaranteed.
Should you use Ichimoku on its own?
Usually not. It is better used with price structure, support and resistance, volume, or another momentum tool. The goal is confirmation, not indicator overload.


Yes, but it can feel crowded at first. Beginners usually do better when they start with three basics: price above, below, or inside the cloud; the direction of the cloud; and the Tenkan-sen/Kijun-sen crossover.