
RSI is one of those indicators almost every trader sees early on, and just as many traders misuse just as quickly.
The Relative Strength Index measures momentum on a scale from 0 to 100. In plain English, it helps you judge whether price has pushed too far, too fast. That makes it useful for spotting potential reversals, confirming trends, and timing entries a little better.
But RSI is not a magic buy-at-30, sell-at-70 button. Context matters. A reading that looks overbought in a range can stay overbought for a long time in a strong trend.
In this guide, we’ll cover three practical RSI strategies, when each one works best, and the common mistakes that turn a decent setup into a bad trade.
Disclaimer: This guide is for educational purposes only and should not be considered investment advice. Markets are risky, and no indicator guarantees results. Never risk more than you can afford to lose, and consider speaking with a qualified financial advisor before making trading decisions.
What RSI actually tells you
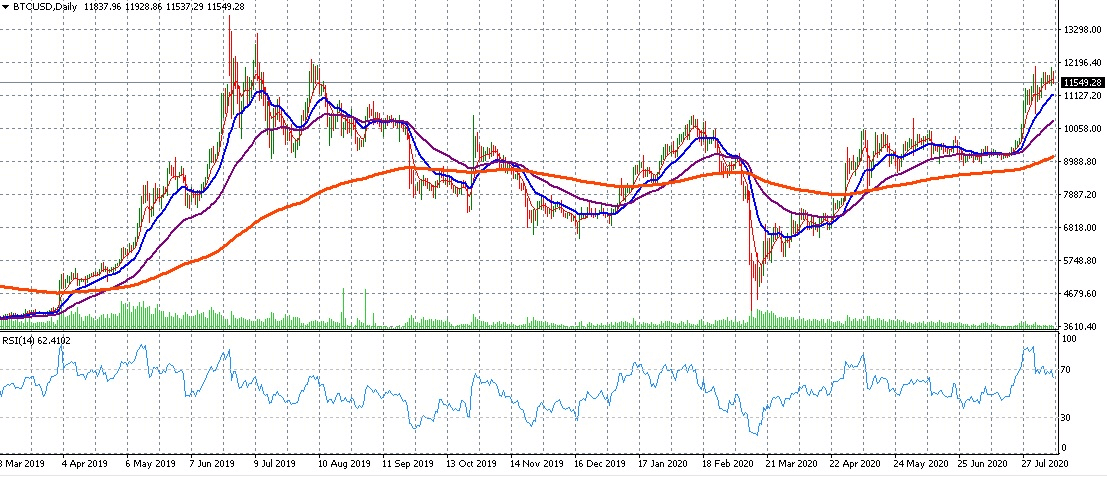
RSI was developed by J. Welles Wilder Jr. and introduced in New Concepts in Technical Trading Systems. The standard setting is 14 periods, and the indicator compares recent gains with recent losses to estimate momentum.
Most traders use these reference levels:
- Above 70: often treated as overbought
- Below 30: often treated as oversold
- Around 50: a useful centerline for judging bullish or bearish momentum
That said, overbought does not automatically mean “sell now,” and oversold does not automatically mean “buy now.” RSI works best when you combine it with market structure, trend direction, and basic risk management.
If you want a broader refresher on indicators and chart reading, start with our technical analysis guide.
Strategy 1: RSI mean reversion in ranging markets
This is the classic RSI setup, and it works best when price is moving sideways rather than trending hard.
In a range, price often swings between support and resistance. RSI can help you spot when momentum is stretched near those edges.
How it works
- Look for a market that is clearly ranging
- Watch for RSI to move below 30 near support
- Wait for RSI to cross back above 30 as momentum stabilises
- For short setups, watch for RSI above 70 near resistance, then a move back below 70
The key detail is confirmation. Many traders jump in the moment RSI touches an extreme level. A cleaner approach is to wait for RSI to leave the oversold or overbought zone, which suggests the momentum burst may be fading.
When this strategy works best
- Sideways markets
- Clear support and resistance zones
- Assets with repeatable short-term swings
When it struggles
- Strong trends
- Breakout conditions
- News-driven volatility
If price is trending aggressively, RSI can stay pinned in extreme territory longer than most traders expect. That is where “cheap” gets cheaper and “too expensive” gets even more expensive.
Strategy 2: RSI centerline crossover for trend confirmation
Not every RSI strategy needs overbought and oversold levels. One of the simplest ways to use the indicator is the 50 level.
Think of the centerline as a momentum filter:
- Above 50: bullish momentum is stronger
- Below 50: bearish momentum is stronger
How it works
- Identify the broader trend on the chart
- Use RSI crossing above 50 to support long setups in an uptrend
- Use RSI crossing below 50 to support short setups in a downtrend
This approach is less about catching tops and bottoms and more about trading with the prevailing move. It is often more reliable than pure mean reversion when markets are trending.
Example logic
Suppose price is making higher highs and higher lows. Instead of shorting every RSI reading above 70, you wait for pullbacks and look for RSI to reclaim 50. That gives you a momentum-based reason to rejoin the trend rather than fight it.
This is also a good reminder that RSI is not just a reversal tool. Used properly, it can help you stay on the right side of momentum.
Strategy 3: RSI divergence with price action confirmation
Divergence is one of the most talked-about RSI strategies because it can warn that momentum is weakening before price fully turns.


Bullish divergence
Price makes a lower low, but RSI makes a higher low. That suggests selling pressure may be losing strength.
Bearish divergence
Price makes a higher high, but RSI makes a lower high. That suggests buying momentum may be fading.
How to trade it more carefully
Divergence is a warning, not an entry by itself. The better approach is to combine it with price action, such as support or resistance, trendline breaks, candlestick rejection, or market structure shifts like a lower high or higher low.
Without confirmation, divergence can appear early and stay early. Markets are rude like that.
If you want to build better confirmation around RSI signals, it helps to pair it with broader chart structure and momentum tools. Readers exploring indicator-based setups can also look at the AltAlgo indicator for additional confirmation.
How to choose the best RSI settings
The default RSI setting is 14 periods, and for many traders that is still the best place to start.
Changing the period changes the indicator’s sensitivity:
- RSI 7: faster, more sensitive, more signals, more noise
- RSI 14: balanced default
- RSI 21: slower, smoother, fewer signals
You can also adjust the overbought and oversold levels:
- 70/30: standard setting
- 80/20: fewer but stricter signals
- 60/40: sometimes used in trend-following approaches
There is no universal best RSI setting for every market and timeframe. A setup that behaves well on a 4-hour crypto chart may be far too noisy on a 5-minute forex chart. The sensible route is to test one market, one timeframe, and one ruleset at a time.
Common RSI mistakes
- Using RSI in isolation: momentum matters, but structure matters too
- Shorting every overbought reading: strong trends can stay overbought
- Buying every oversold reading: falling markets can stay weak longer than expected
- Changing settings constantly: too much tweaking usually creates confusion, not edge
- Ignoring risk management: even a good setup can fail
A practical fix is to define your rules before the trade: entry trigger, invalidation level, and exit plan. That sounds basic because it is basic, and basic usually beats improvising.
Should you use RSI for exits?
RSI can help with exits, but it is often better as an entry or confirmation tool than as a standalone exit signal.
For example, closing a long trade just because RSI reaches 70 can cut strong trends short. Many traders prefer to manage exits with:
- previous swing highs or lows
- support and resistance
- trailing stops
- risk-reward targets
That way, you give the trade room to develop instead of letting one indicator force an early exit.
Final thoughts
The best RSI strategy depends less on the indicator itself and more on the market conditions you apply it to.
If the market is ranging, mean reversion can make sense. If the market is trending, the centerline crossover is often more useful. If momentum and price start disagreeing, divergence can help you spot a possible turning point.
Used with context, RSI is a solid tool. Used blindly, it becomes a fast way to take trades you did not really think through.
Keep the rules simple, test them properly, and let the market tell you which version of RSI actually fits your style.