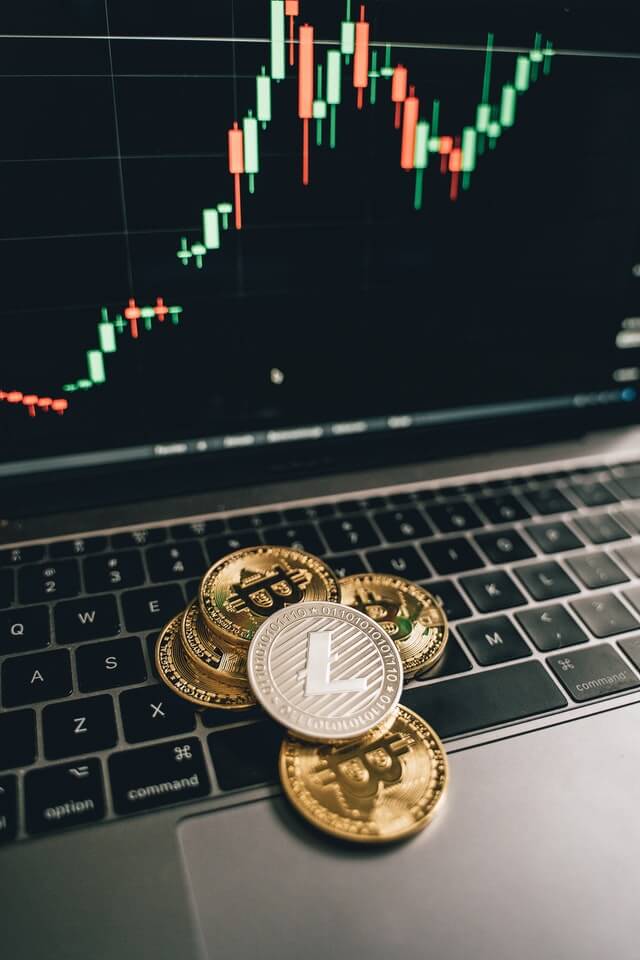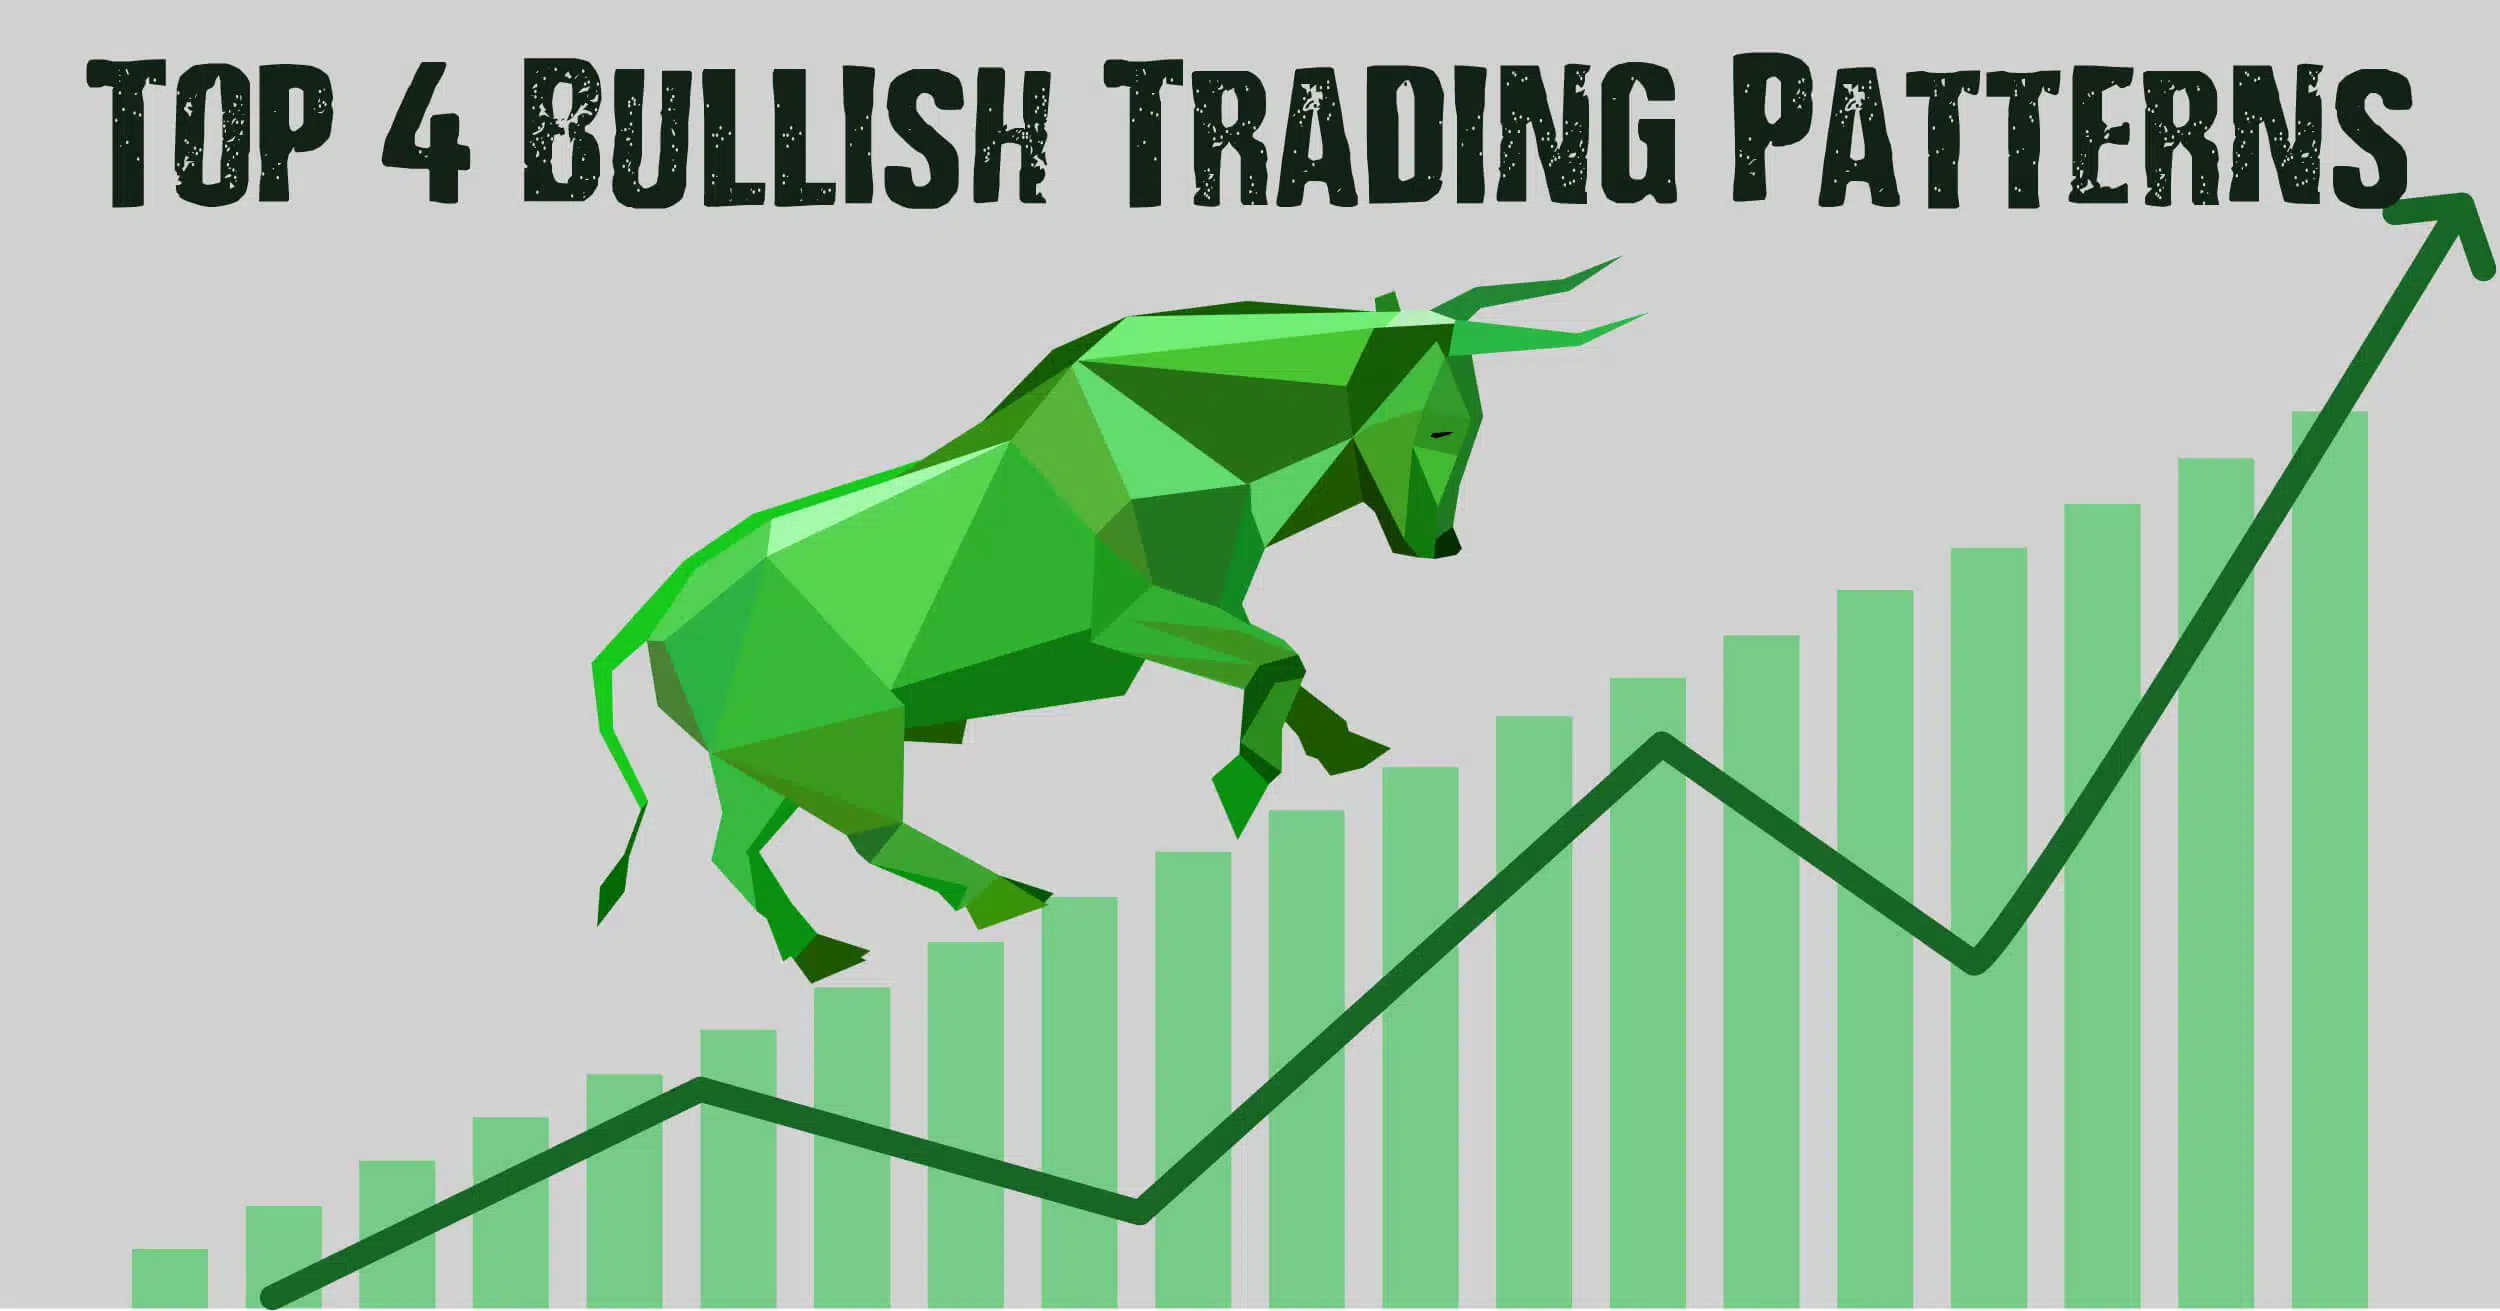
In this article, we will share with you which are some of the most popular crypto trading patterns in the cryptocurrency market that indicate and show bullish momentum in a specific trading pair. As the cryptocurrency space continues to attract investors from all over the world, many users are trying to learn how to better profit by trading digital assets.Although having these trading patterns doesn’t mean that there will be a reversal or that there will be a bullish movement with 100% certainty. This is due to the fact that we handle different possibilities in the market. Disclaimer: all the information provided in this article must not be considered investment advice and it shouldn’t be used by traders and users to trade virtual currencies or any other asset. Always contact your financial advisor and never invest more than what you are able to lose. This article is only for educational purposes.
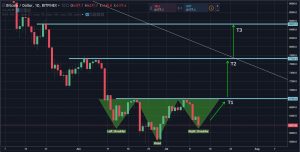
Inverse Head And Shoulders
Inverse Head and Shoulders (H&S) are one of the most popular patterns for traders. This pattern is very clear and can predict both bullish or bearish reversals. Head and Shoulders patterns tend to also be very reliable and helpful for investors that want to understand when to enter or exit the market at a specific moment in time. As we mentioned in a previous article, this pattern is recognizable because there will be three moments for the traders. The first one is a left shoulder in which the price falls, then recovers into the neckline. The second step is falling into the second downward peak that will be the head. This will certainly be the lowest price the pattern will reach within this pattern. Once reaching this price level, the pattern will continue forming another shoulder on the right side that will be lower than the first one. After all this pattern plays off, the market should now move into higher highs and lows.
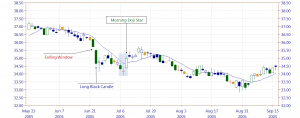
Morning Doji Star
The previous pattern can be performed in both charts with candles or lines. However, there are some indicators that can be seen in candles. For example, the morning Doji star would represent a bullish pattern. This could signify an important bullish trend being formed that could eventually push traders into entering the market. The first candle will be one that will be a clear medium-size negative candle. The second one should be a Doji negative candle and the third one is already a green candle moving higher and showing a change in the trend. There are several candlestick patterns that can take place in the market, but this is generally one of the most commons to detect a trend reversal for traders.
Triple and Double Bottoms
Bottoms can also be reached in different ways and be certainly marked. For example, it may be possible to get a triple or double bottom that would already show there is a resistance being formed at a specific price level. Double bottoms are very useful in order to understand whether the price of a specific cryptocurrency is going to keep falling or not. In this case, a double bottom will be present when the price of a digital asset falls and finds a strong support in a specific zone. The process will be repeated twice, which would be indicating a double bottom.


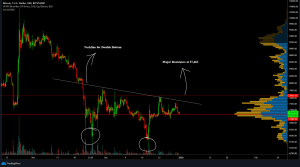
Meanwhile, a triple bottom will clearly be the moment in which the price of a virtual currency falls and finds strong support in a specific price zone. This support will work on three different occasions in a middle or short period of time. If traders find this to be a good indicator, they can start paying attention to it and understand whether the market is changing trend or not. Although this doesn’t have an effectivity of 100% it can be a good indicator to add to our list of bullish patterns we can find int eh crypto market. AltSignals, one of the most popular crypto trading signals providers in the market is always analysing the charts so as to better provide users with better trading strategies.
Conclusion
We have shared with you the top 4 bullish trading patterns in the cryptocurrency market. This is certainly going to be helping users and traders perform the necessary trading strategies, increase their profits and feel more comfortable understanding and reading charts. However, it is always worth taking into account that these patterns may not always provide 100% effectivity rates. This is why it would certainly be recommended to receive clear information from professional advisors.