


If you use TradingView, indicators are one of the fastest ways to turn a blank chart into something useful. The problem is that beginners often add too many, stack conflicting signals, and end up with a chart that looks clever but says very little.
This guide shows you how to use indicators in TradingView step by step, how to adjust them properly, and how to avoid the common mistakes that make indicators less useful than they should be.
Disclaimer: This article is for educational purposes only and should not be considered financial advice. Trading involves risk, and indicators do not guarantee profitable trades. Never risk more than you can afford to lose, and consider speaking with a qualified financial adviser before making investment decisions.
What are indicators in TradingView?
Indicators are chart-based tools that help you analyse price, momentum, trend, volatility, and volume. In TradingView, they sit on top of the chart or below it and turn raw market data into something easier to read.
For example:
- Trend indicators such as moving averages help show direction.
- Momentum indicators such as RSI help show whether price is accelerating or slowing.
- Volatility indicators such as Bollinger Bands help show how much price is expanding or contracting.
- Volume indicators help show participation behind a move.
That said, indicators do not predict the future. Most are derived from price and volume, which means they help you interpret the market rather than magically front-run it.
If you want a broader foundation first, start with this technical analysis guide.
How to add indicators in TradingView
If your goal is simply to get an indicator onto the chart, the process is straightforward:
- Open TradingView and load the chart you want to analyse.
- Choose the market and symbol, such as BTC/USD, EUR/USD, or a stock ticker.
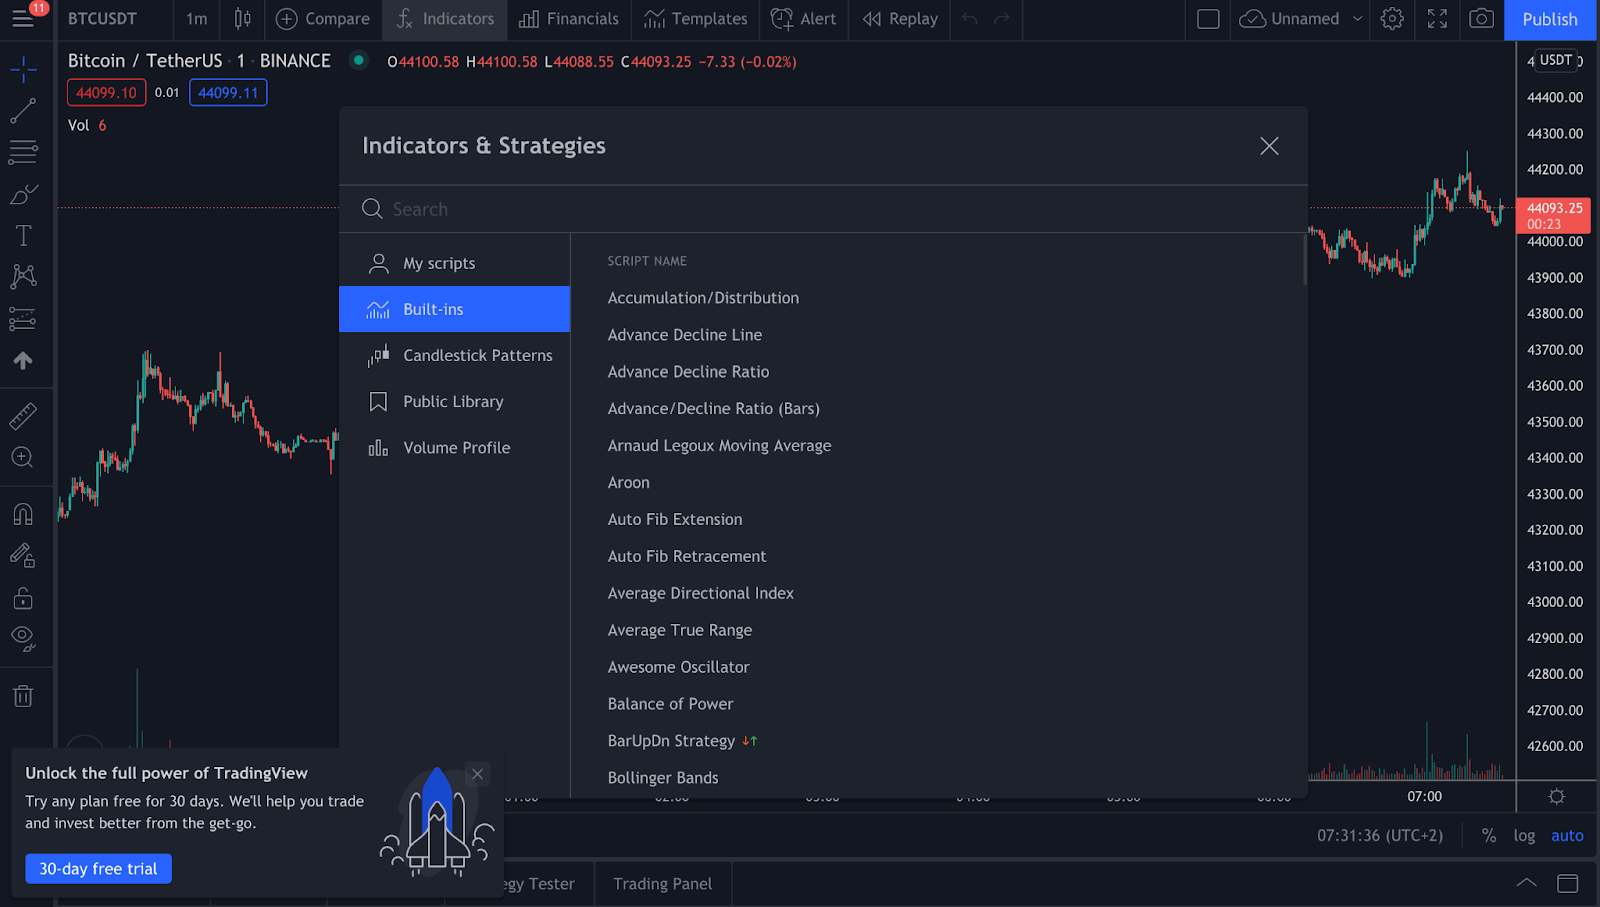
- Click the Indicators button near the top of the chart.
- Search for the indicator you want, or browse the built-in categories.
- Click the indicator name to add it to your chart.
Built-in indicators are usually the best place to start. TradingView also includes community scripts, but those vary in quality and can be harder to interpret if you are still learning the basics.
How to customise an indicator
Adding an indicator is the easy part. Using it properly is where most traders either improve or quietly sabotage themselves.
Once an indicator is on the chart:
- Hover over the indicator name.
- Click the Settings icon.
- Adjust inputs such as length, source, smoothing, colours, or display style.
- Save the changes and review how the indicator behaves on your timeframe.
A simple example is a moving average. A shorter setting reacts faster but creates more noise. A longer setting is smoother but slower. Neither is “best” in every market. The right setting depends on your timeframe, the asset you trade, and whether you are looking for trend confirmation or faster entries.
That is why copying someone else’s settings without understanding them usually ends badly. The chart may look professional, but your decisions may not be.
How to remove, hide, and manage indicators
TradingView makes it easy to manage indicators once they are loaded:
- Hide an indicator: click the eye icon next to its name.
- Remove an indicator: click the X on the indicator label or open the object tree.
- Reorder panes: drag indicators up or down if they appear in separate panels.
- Save your layout: save the chart layout so you do not rebuild the same setup every session.
If you regularly analyse different markets, saving separate layouts for crypto, forex, and stocks can keep things cleaner.
Which indicators should beginners start with?
If you are new to TradingView, start with a small set of indicators that do different jobs. A good beginner combination is:
- One trend indicator: for example, a moving average
- One momentum indicator: for example, RSI
- One volume or volatility tool: for example, volume or Bollinger Bands
This gives you a more balanced read of the chart without piling on five versions of the same idea.
For example, you might use:
- A moving average to identify trend direction
- RSI to check whether momentum is stretched
- Volume to see whether the move has participation behind it
If all three broadly support the same view, that can be more useful than relying on one signal in isolation.
What is the best indicator in TradingView?
There is no single best indicator in TradingView.
That answer is less exciting than people hope, but it is the honest one. Different indicators work better in different conditions. Trend tools tend to perform better in directional markets. Oscillators can be more useful in ranges. Volume can help confirm breakouts, but it will not tell you everything on its own.


A better question is: which indicator fits your strategy?
Good traders usually build a simple process rather than hunt for a magic tool. That process might include:
- identifying trend
- marking support and resistance
- checking momentum
- waiting for price confirmation
- managing risk before entering
If you want to sharpen that side of your chart work, it also helps to understand support and resistance trading strategy and RSI divergence.
Common mistakes when using indicators in TradingView
Most indicator problems are not caused by TradingView. They are caused by how traders use the tools.
- Using too many indicators: more signals do not always mean better decisions.
- Stacking similar tools: adding MACD, RSI, and Stochastic together can create overlap rather than clarity.
- Ignoring market context: indicators work differently in trends, ranges, and high-volatility conditions.
- Changing settings constantly: tweaking inputs after every losing trade is not optimisation. It is usually frustration wearing a lab coat.
- Skipping risk management: even a strong setup can fail.
The cleaner approach is to choose a small number of indicators, learn what each one actually measures, and test them consistently.
Can you apply one indicator to another in TradingView?
Yes. TradingView supports applying one indicator or strategy to another indicator in certain cases, which can be useful for more advanced chart setups. For example, some traders apply a moving average to RSI rather than directly to price.
This is more of an intermediate feature than a beginner one, but it can help if you want to smooth signals or build layered analysis. TradingView explains the process in its support documentation.
Using custom indicators in TradingView
Beyond built-in tools, TradingView also offers community-made indicators and scripts. These can be useful, but they need more caution.
Before using a custom script, check:
- what the indicator is actually measuring
- whether the logic is explained clearly
- if it repaints or changes historical signals
- whether it suits your market and timeframe
If a script looks impressive but you cannot explain what it does in one sentence, do not trade off it yet.
AltAlgo on TradingView
If you want a more structured indicator workflow, AltSignals offers the AltAlgo indicator, which is built for traders who want clearer chart-based signals inside TradingView.
Rather than relying on a random mix of public scripts, many traders prefer using one consistent tool alongside their own market analysis, risk rules, and confirmation process. That is the sensible way to use any indicator, proprietary or otherwise.
Used properly, an indicator should support your decision-making, not replace it.
Final thoughts
Learning how to use indicators in TradingView is not really about clicking the right menu. It is about understanding what each tool measures, when it helps, and when it adds noise.
Start simple. Use a few indicators with clear roles. Test them on the markets and timeframes you actually trade. And remember that even the best-looking chart setup still needs discipline, context, and risk management behind it.
FAQ
How do I find all indicators in TradingView?
Why can’t I add more indicators in TradingView?
TradingView plan limits can affect how many indicators you can load on one chart. If you hit a limit, remove unused indicators, simplify your layout, or check the features included in your current subscription.
Are TradingView community indicators reliable?
Some are useful, but reliability varies. Always check what the script does, whether it repaints, and whether the logic is explained clearly before using it in live trading.
What is the easiest indicator for beginners on TradingView?
Many beginners start with moving averages, RSI, and volume because they are simple to read and each serves a different purpose. The key is not choosing the perfect indicator but learning how to interpret one properly.


Click the Indicators button at the top of the chart. From there, you can browse built-in indicators, saved favourites, and community scripts. Using the search bar is usually the fastest option.