Bitcoin, XRP, and FET: Key Support and Resistance Levels Define the Next Move in Crypto Markets
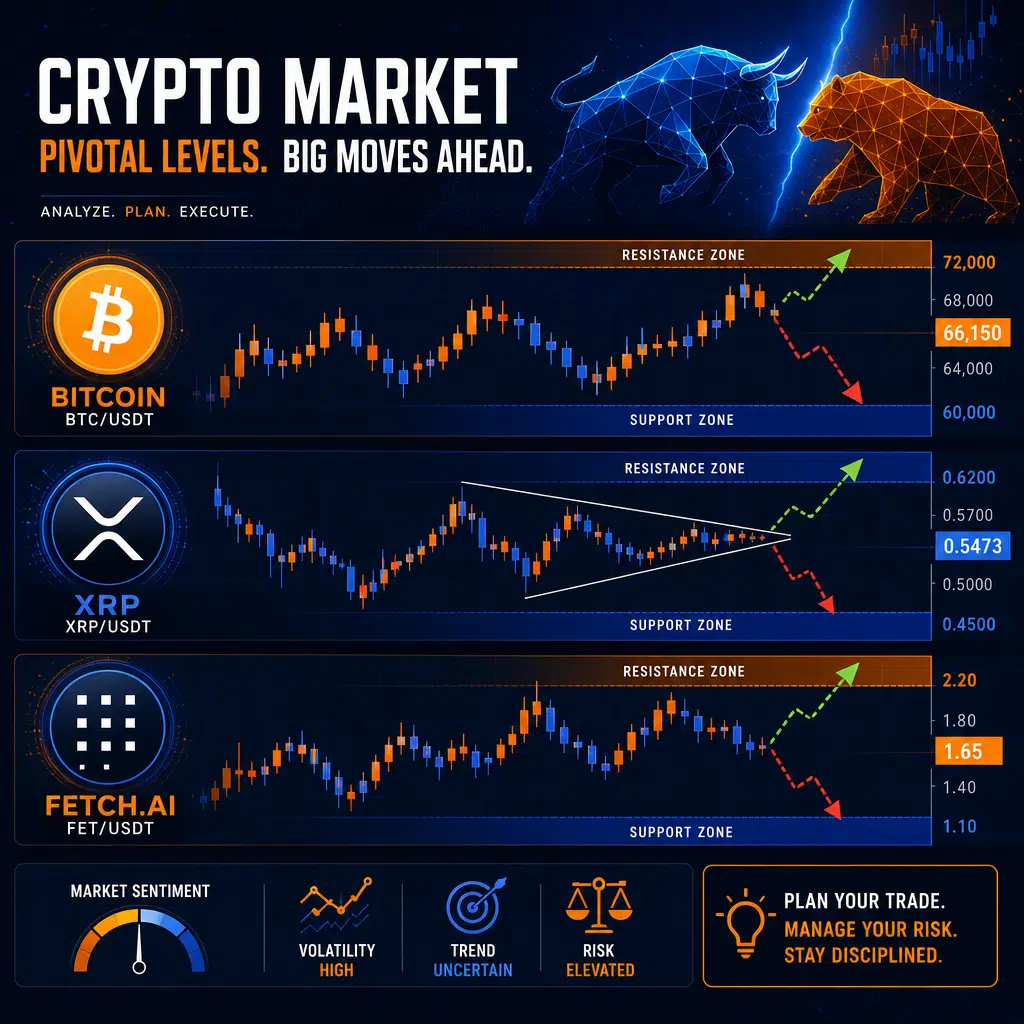
After a turbulent period characterized by mixed sentiment and significant volatility, three prominent cryptocurrencies—Bitcoin (BTC), Ripple’s XRP, and Fetch.ai’s FET—are currently positioned at critical technical levels. Their next moves could potentially dictate broader market trends as they test major support and resistance barriers. This comprehensive analysis explores the technical outlook, indicator readings, and likely scenarios for each asset as of today’s session.
Bitcoin Tests Support After Consecutive Losses: Will the Uptrend Hold?
Bitcoin has endured notable selling pressure over the past several days, culminating in three consecutive daily losses that have seen its price retreat from approximately $78,000 to lows near $72,500. This correction places Bitcoin at a decisive juncture: retesting a long-standing ascending trendline that has provided reliable support since February. Historically, this trendline has facilitated bullish reversals, sparking upward moves in both late February and March. The market’s eyes are now keenly focused on whether this level can once again anchor Bitcoin’s price action.
Key price levels to monitor in today’s trading include the trendline currently supporting price action, along with horizontal resistance at $74,400 and $77,700. A decisive move above these levels could signal renewed bullish momentum, while a breakdown would bolster a prevailing bearish trend.
Technical Indicators: A Mixed Picture
- Relative Strength Index (RSI): Reading 38.142 — This places RSI below the neutral threshold (50), indicating that sellers currently have the edge, but the indicator has not entered deeply oversold conditions. As a result, continued downward pressure is possible if support fails to hold.
- Stochastic Oscillator: Reading 97.419 — The indicator is deep in overbought territory. While this can indicate a forthcoming rebound, it may also signal that upward momentum is capped in the short term.
- MACD: Reading -797.7 — This negative value reflects entrenched bearish momentum, with the histogram and moving averages below their respective neutral lines. The signal remains pessimistic for bulls.
- Ultimate Oscillator: Reading 54.833 — With a reading slightly above 50, this momentum indicator suggests that some buying interest is persisting, providing hope for a defense of current support levels.
| Indicator Metric | Reading | Interpretation |
|---|---|---|
| RSI (14) | 38.142 | Sellers still have an advantage and downside pressure remains present |
| STOCH (9,6) | 97.419 | Overbought reading may limit immediate upside |
| MACD (12,26) | -797.7 | Bearish momentum remains dominant |
| Ultimate Oscillator | 54.833 | Buyers are still defending key support levels |
Bitcoin Price Scenarios for Today
- Bullish Scenario: Least likely given current momentum. BTC must reclaim $74,400 and decisively surpass $77,700. Only then would a stronger bullish reversal be in play, potentially leading to higher highs before the next daily close.
- Neutral Scenario: A bounce above $74,400 could temper immediate bearish sentiment, perhaps initiating range-bound trading between $74,400 and $77,700.
- Bearish Scenario: Remaining below $74,400 keeps the broader trend negative. Additional weakness could see Bitcoin languish beneath support, though the trendline may offer temporary relief and facilitate a medium-term recovery attempt.
XRP Rebounds From Key Support: Is a Trend Reversal Imminent?
XRP, Ripple’s native asset, is displaying tentative signs of recovery after enduring a prolonged descent. After descending as low as $1.26 during Thursday’s broad market pullback, buyers have since intervened, lifting XRP to a current price near $1.32. The asset is now contending with resistance around $1.33, and a decisive break above could lay the foundation for a rally towards $1.37 and potentially higher targets at $1.40.
While the immediate outlook for XRP hinges on its ability to overcome this resistance, the asset’s ability to bounce from the $1.26 level underscores robust underlying demand, at least over the short term.
XRP: What are the Indicators Saying?
- RSI: Reading 49.911 — Balanced almost perfectly at the neutral midpoint, suggesting that neither buying nor selling pressure is dominant at present.
- Stochastics: Reading 68.791 — Favors the bulls, indicating improving positive momentum following the recent rebound.
- MACD: Reading -0.007 — The indicator is near its neutral line, pointing to a significant weakening in bearish momentum. A shift into positive territory could mark the start of a bullish reversal.
- Ultimate Oscillator: Reading 50.571 — This neutral value reinforces the view of equilibrium between buyers and sellers.
| Indicator Metric | Reading | Interpretation |
|---|---|---|
| RSI (14) | 49.911 | Market remains balanced between buyers and sellers |
| STOCH (9,6) | 68.791 | Buying pressure is gradually improving |
| MACD (12,26) | -0.007 | Bearish trend is weakening |
| Ultimate Oscillator | 50.571 | Market remains neutral overall |
XRP Price Predictions: Paths Forward
- Bullish Scenario: A less likely outcome unless XRP clears $1.33, and even more so if resistance at $1.37 is broken. Success at these levels could pave the way to $1.40 and invigorate bullish traders.
- Neutral Scenario: If XRP breaks above $1.33 but stalls at $1.37, expect range-bound trading as the asset consolidates and the market awaits further signals.
- Bearish Scenario: As long as XRP is held below $1.33 by persistent resistance, the risk of renewed weakness remains. A failed rally attempt could trigger a retest of the $1.26 support zone.
FET Token: Prolonged Battle With Key Resistance Near $0.26
Fetch.ai’s FET token has been locked in a challenging contest at its critical resistance level of $0.26 for the past several sessions. Despite multiple attempts, buyers have failed to break this psychological and technical barrier, keeping the token in a tight range between $0.24 (support) and $0.26 (resistance). This tug of war is emblematic of indecision in the market. A clear breakout above resistance could trigger a sustained bullish rally, while a dip below support would hand sellers clear control.


What Do the Technical Indicators Reveal for FET?
- RSI: Reading 57.439 — Indicates a modest advantage for buyers, with the indicator comfortably above neutral territory.
- Stochastics: Reading 56.511 — Confirms that positive momentum is, for now, propelling the asset upward, despite repeated resistance at $0.26.
- MACD: Reading 0.007 — The positive MACD supports a generally bullish trend, albeit a mild one.
- Ultimate Oscillator: Reading 49.228 — Marginally below 50, highlighting the close battle between bulls and bears; neither side is fully in command.
| Indicator Metric | Reading | Interpretation |
|---|---|---|
| RSI (14) | 57.439 | Buyers currently hold a slight advantage |
| STOCH (9,6) | 56.511 | Positive momentum remains intact |
| MACD (12,26) | 0.007 | Trend remains mildly bullish |
| Ultimate Oscillator | 49.228 | Market remains close to neutral conditions |
FET Forecast: What Lies Ahead?
- Bullish Scenario: A breakout above the stubborn $0.26 barrier, which has not been breached since March, would represent a significant technical event. Such a move could propel FET higher, potentially targeting resistance areas not seen since January.
- Neutral Scenario: Failure by either side to assert itself would see FET confined in the $0.24 to $0.26 range, extending the ongoing period of consolidation and market indecision.
- Bearish Scenario: Should sellers force a dip below $0.24, and buyers are unable to reclaim lost ground, the token could be exposed to a decline toward the next support near $0.22.
Long-Term Outlooks and FAQs
Bitcoin Price Projections
Forecasts for Bitcoin’s value by 2030 typically range from $300,000 to $1.5 million per BTC, with even loftier projections contingent on broad institutional adoption and favorable macroeconomic tailwinds. By 2040, some analysts see potential for Bitcoin to approach or even exceed the $1 million mark, although more optimistic models estimate unprecedented highs of up to $14 million under extreme scenarios.
FET’s Future Prospects
The outlook for FET is closely tied to the expansion of decentralized AI solutions. The Artificial Superintelligence Alliance, which encompasses Fetch.ai, has strengthened the asset’s ecosystem. If adoption accelerates, analysts expect price targets in the range of $2.50 to over $10.00 by 2030—though these targets rest heavily on technological and partnership developments.
Is Holding XRP Still Worth It?
XRP remains a staple in portfolios aiming for exposure to the cross-border payments sector and potential institutional inflows. With current prices around $1.32, XRP is best characterized as a conservative, long-term pick rather than a high-risk, high-reward short-term play. Its established utility and gradual regulatory progress position it as a foundation asset as opposed to a rapid mover.
Conclusion: Awaiting Direction Amid Uncertainty
The coming sessions are pivotal for Bitcoin, XRP, and FET, with each asset perched atop or below influential support and resistance levels. Short-term technical indicators are mixed, highlighting heightened uncertainty and the likelihood of sharp moves should any of these key levels give way. Traders and investors are advised to monitor price action closely for confirmation of either a sustained recovery or another round of declines as the market digests evolving macro and crypto-specific narratives. As always, prudent risk management and ongoing analysis are essential amid such volatile conditions.